Introduction to Data Science Techniques
In today’s world, where data is the new gold, different kinds of analysis are available for a business to do. The result of a data science project varies greatly with the type of data available, and hence the impact is a variable as well. Since there is a lot of different kind of analysis available, it becomes imperative to understand what a few baselines techniques need to be selected. The essential goal of data science techniques is to search for relevant information and detect weak links, which tend to make the model perform poorly.
What is Data Science?
Data science is a field that spreads over several disciplines. It incorporates scientific methods, processes, algorithms, and systems to gather knowledge and work on the same. This field includes various genres and is a common platform for the unification of statistics, data analysis, and machine learning. In this, the theoretical knowledge of statistics and real-time data and techniques in machine learning work hand-in-hand to derive fruitful outcomes for the business. Using different techniques employed in data science, we in today’s world can imply better decision making, which otherwise might miss from the human eye and mind. Remember, the machine never forgets! To maximize profit in a data-driven world, the magic of Data Science is a necessary tool to have.
Different types of Data Science Technique
In the following few paragraphs, we would look into common data science techniques used in every other project. Though sometimes the data science technique can be business problem-specific and might not fall in the below categories, it is perfectly okay to term them as miscellaneous types. We divide the techniques into Supervised (we know target impact) and Unsupervised (We don’t know about the target variable we are trying to achieve). In the next level, the techniques can be divided in terms of
- The output we would get or what is the intent of the business problem
- Type of data used.
Let us first look at segregation based on intent.
1. Unsupervised Learning
- Anomaly Detection
In this type of technique, we identify any unexpected occurrence in the entire dataset. Since the behaviour differs from the actual happening of data, the underlying assumptions are:
- The occurrence of these instances is minimal in number.
- The difference in behaviour is significant.
Anomaly algorithms are explained, such as the Isolation Forest, which provides a score for each record in a dataset. This algorithm is a tree-based model. Using this type of detection technique and its popularity, they are used in various business cases, for example, Web Page views, Churn Rate, Revenue per click, etc. In the below graph, we can explain what an anomaly looks like.
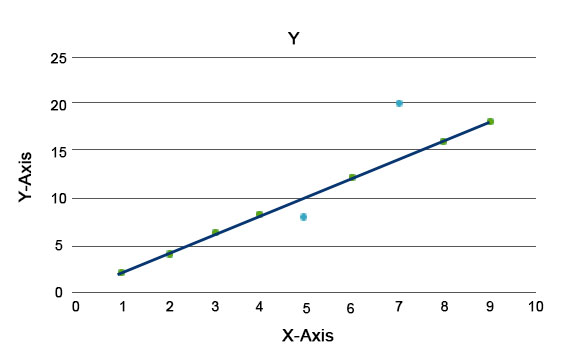
Here the ones in blue represent an anomaly in the dataset. They vary from the regular trend line and are less in occurrence.
- Clustering Analysis
Through this analysis, the main task is to segregate the entire dataset into groups so that the trend or traits in one group data points are similar. In data science terminology, we call these the cluster. For example, there is a plan to scale the business in the retail business, and it becomes imperative to know how the new customers would behave in a new region based on the past data we have. It becomes impossible to devise a strategy for each individual in a population. Still, it will be useful to bucket the population into clusters to be effective in a group and is scalable.
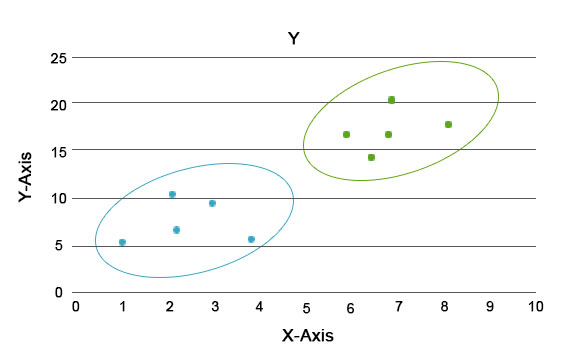
Here the blue and orange colours are different clusters having unique traits within themselves.
- Association Analysis
This analysis helps us in building interesting relationships between items in a dataset. This analysis uncovers hidden relationships and helps represent dataset items in the form of association rules or sets of frequent items. The association rule is broken down into 2 steps:
- Frequent Itemset Generation: In this, a set is generated where frequently occurring items are set up together.
- Rule Generation: The set built above is passed through different rule formation layers to build a hidden relationship between themselves. For example, the set can fall into either conceptual or implementation issues or application issues. These are then branched down in respective trees to build the association rules.
For example, APRIORI is an association rule building algorithm.
2. Supervised Learning
- Regression Analysis
In regression analysis, we define the dependent/target variable and the remaining variables as independent variables and eventually hypothesize how one/more independent variables influence the target variable. The regression with one independent variable is called univariate, and with more than one is known as multivariate. Let us understand using univariate and then scale for multivariate.
For example, y is the target variable, and x1 is the independent variable. So, from the straight line knowledge, we can write the equation as y = mx1 + c. Here “m” determines how strongly x1 influences y. If “m” is very close to zero, it means that with a change in x1, y is not affected strongly. With a number greater than 1, the impact gets stronger, and a small change in x1 leads to a big variation in y. Similar to univariate, in multivariate can be written as y = m1x1 + m2x2 + m3x3………., here the impact of each independent variable is determined by its corresponding “m”.
- Classification Analysis
Similar to clustering analysis, Classification algorithms are built having the target variable in the form of classes. The difference between clustering and classification lies in the fact that we don’t know which group the data points fall in, whereas, in classification, we know which group it belongs to. And it differs from regression from the perspective that the number of groups should be a fixed number; unlike regression, it is continuous. There are many algorithms in classification analysis, for example, Support Vector Machines, Logistic Regression, Decision Trees, etc.
Conclusion
In conclusion, we understand that each type of analysis is vast, but we can provide a small flavour to different techniques. In the next few notes, we would separately take each of them and go into details on different sub-techniques employed in each parent technique.
Recommended Articles
This is a guide to Data Science Techniques. Here we discuss the introduction and different types of techniques in data science in detail. You can also go through our other suggested articles to learn more –
