Updated June 6, 2023
Coefficient of Variation Formula (Table of Contents)
What is the Coefficient of Variation Formula?
In statistics, the coefficient of variation, also termed CV, is a tool that helps us to determine how data points in a data set are distributed around the mean. All the data points are plotted first, then the coefficient of variation is used to measure the dispersion of those points from each other and the mean. So it helps us understand the data and see the pattern it forms. It is calculated as a ratio of the standard deviation of the data set to the mean value. A higher coefficient of variation means that there is a greater level of dispersion of data around the mean.
Similarly, the lower the value of the coefficient of variation, the lesser the dispersion, and the more precise the results will be. Even if the mean of two data series is considerably different, the coefficient of variation is very useful to compare the degree of variation from one data series to the other.
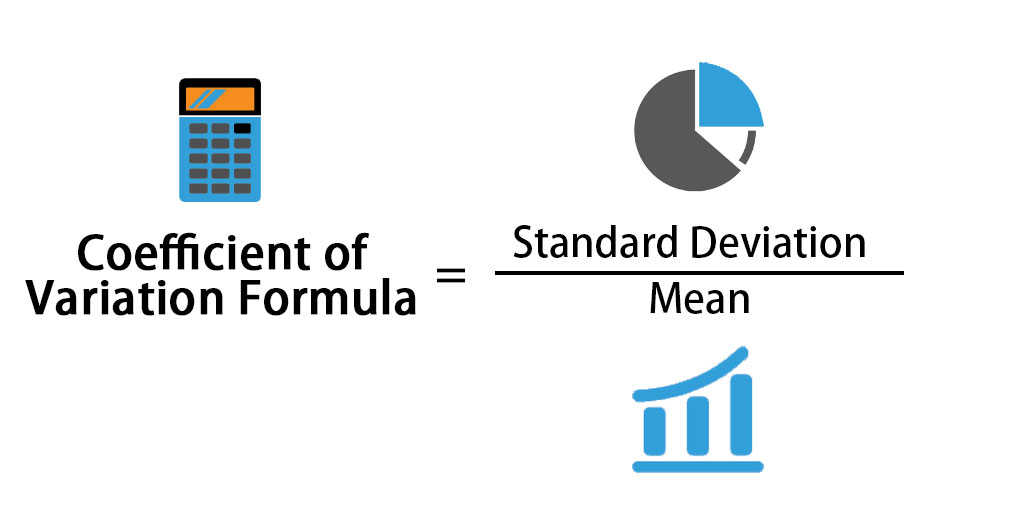
The formula For the Coefficient of Variation is given:
Steps to Calculate the Coefficient of Variation:
Step 1: Calculate the mean of the data set. To calculate the mean, add up all the values and divide the total by the number of data points. The mean represents the average of the set of values.
Step 2: Then, compute the standard deviation of the data set. That is a little time-consuming process. Standards deviation can be calculated as: √ [Σ(Xi – Xm)2 / (n – 1)]. Xi is the ith data point, and Xm is the mean of the data set. Alternatively, we can find the standard deviation in Excel using STDEV.S() function.
Step 3: Divide standard deviation by mean to get the coefficient of variation.
Examples of Coefficient of Variation Formula (With Excel Template)
Let’s take an example to understand the calculation of the Coefficient of Variation in a better manner.
Coefficient of Variation Formula – Example #1
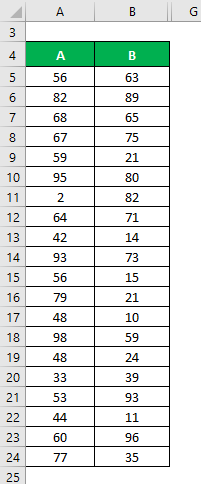
Let’s say we have two data sets, A & B, each containing 20 random data points. Calculate the Coefficient of Variation for the data set X & Y.
Solution:
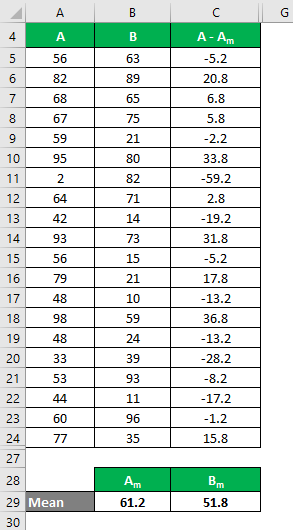
The mean is calculated as follows:
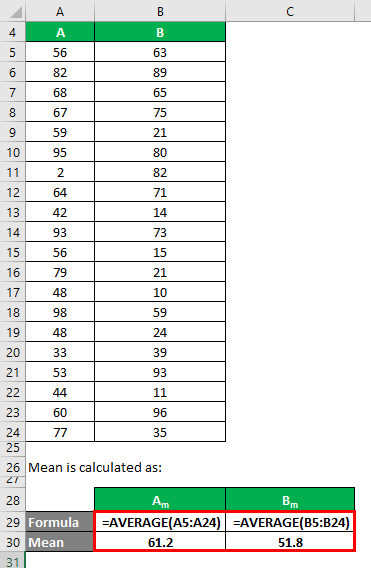
- Mean of Data Set A = 61.2
- Mean of Data Set B = 51.8
We must calculate the difference between the data points and the mean value.
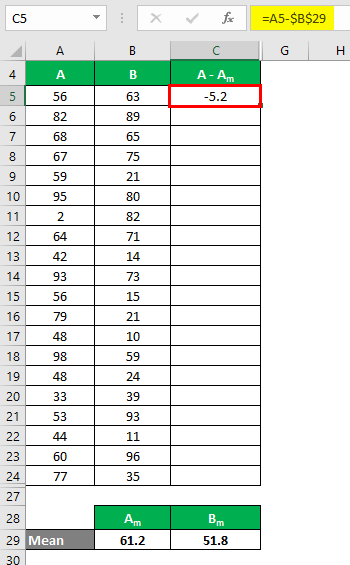
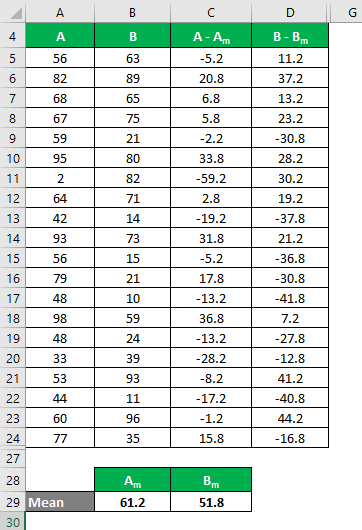
Similarly, calculate all values of the data set A.
Similarly, calculate all values of the data set B.
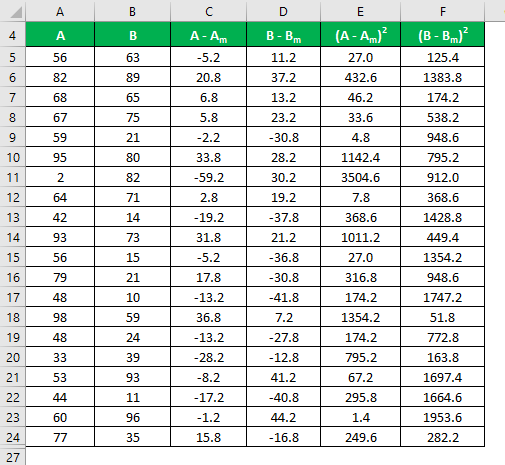
Calculate the square of the difference for both the data sets, A and B.
To calculate the standard deviation, you use the following formula:
Standard deviation = √ [Σ (Xi – Xm)2 / (n – 1)]
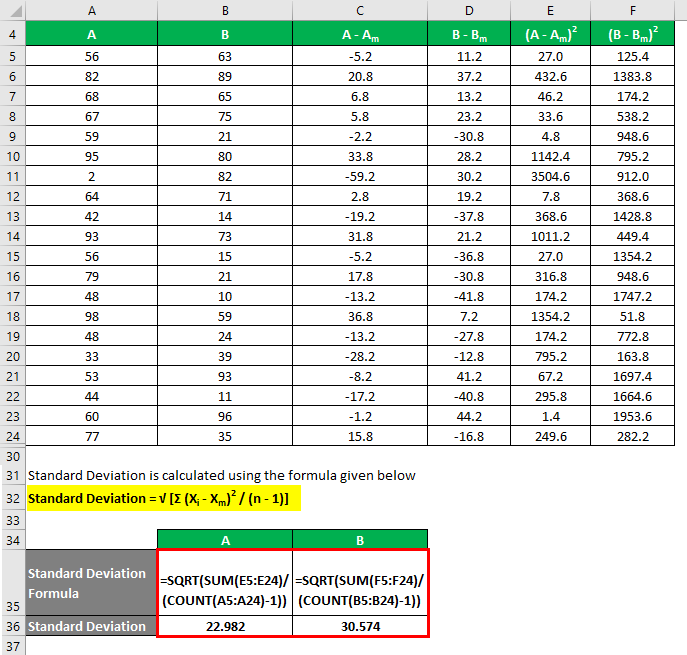
You calculate the coefficient of variation using the following formula:
Coefficient of Variation = Standard Deviation / Mean
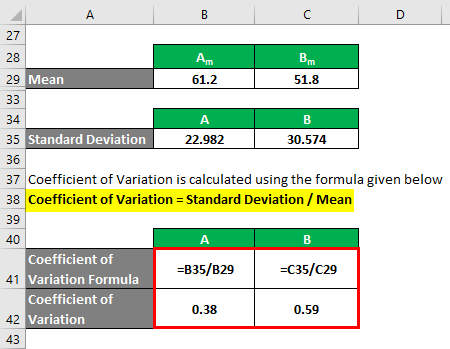
- Coefficient of Variation A = 22.982 / 61.2 = 0.38
- Coefficient of Variation B = 30.574 / 51.8 = 0.59
So if you see here, B has a higher coefficient of variation than A, which means that data points of B are more dispersed than A.
Coefficient of Variation Formula – Example #2
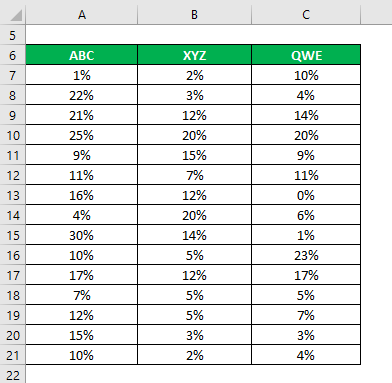
Let’s say you are a very risk-averse investor and you are looking to invest money in the stock market. Since your risk appetite is low, you want to invest in safe stocks with lower standard deviation and coefficient of variation. You have shortlisted 3 shares based on their fundamental and technical information and want to choose 2 stocks. You have also collected information about their historical returns for the last 15 years.
Solution:
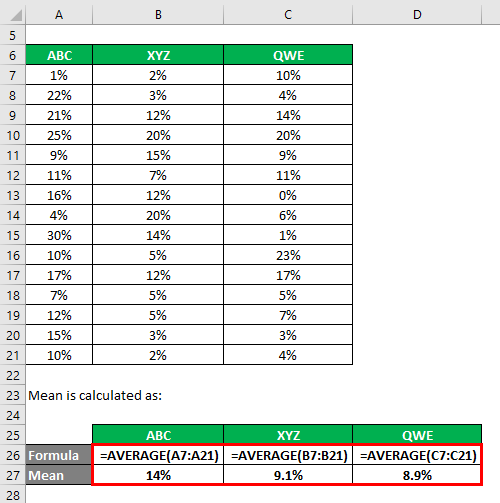
The mean is calculated as follows:
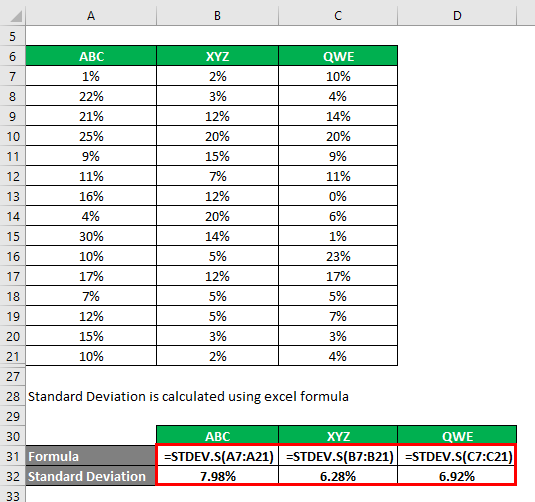
You can calculate the standard deviation using the Excel formula.
Use the following formula to calculate the coefficient of variation:
Coefficient of Variation = Standard Deviation / Mean
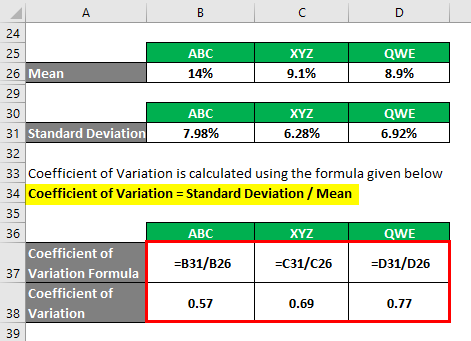
- Coefficient of Variation ABC = 7.98% / 14% = 0.57
- Coefficient of Variation XYZ = 6.28% / 9.1% = 0.69
- Coefficient of Variation QWE = 6.92% / 8.9% = 0.77
Based on the information, you will choose stocks ABC and XYZ to invest in since they have the lowest coefficient of variation.
Explanation
Since the coefficient of variation is a measure of risk, it helps measure the volatility in the prices of stocks and other financial instruments. It also allows investors and analysts to compare the risks of different potential investments.
The coefficient of variation is similar to the standard deviation, but a standard deviation of two variables cannot be compared. But using the standard deviation and the mean makes the relative comparison more meaningful. There is a limitation of the coefficient of variation also. Suppose that mean of a data set is zero. In that case, this tool will become ineffective. Also, if we have a data set with many positive and negative values, the coefficient of variation becomes very problematic. So it is only more helpful with data sets having the same plus-minus sign.
Relevance and Uses of Coefficient of Variation Formula
The coefficient of variation has relevance in many other fields other than statistics. For example, in finance, the coefficient of variation measures risk. The coefficient of variation measures risk, similar to standard deviation, but experts consider it a better indicator of relative risk. For example, let’s say A’s expected return of 15% and B’s expected return of 10%, and A has a standard deviation of 10%, while B has a standard deviation of 5%. To choose a better investment, the coefficient of variation can be used. So the coefficient of variation of A is 10 / 15 = 0.666, and the coefficient of variation of B is 5 / 10= 0.5. So B is a better investment than A.
Recommended Articles
This has been a guide to the Coefficient of Variation Formula. Here we discuss calculating the Coefficient of Variation using a formula, practical examples, and a downloadable Excel template. You may also look at the following articles to learn more –
