EDUCBA

EDUCBA

MENUMENU
  • Blog
  • All Courses
  • All in One Bundle
  • Login
Home Excel Excel Resources Excel Tips Chart Wizard in Excel

Chart Wizard in Excel

Tanuj Kumar
Article byTanuj Kumar
Madhuri Thakur
Reviewed byMadhuri Thakur

Updated August 21, 2023
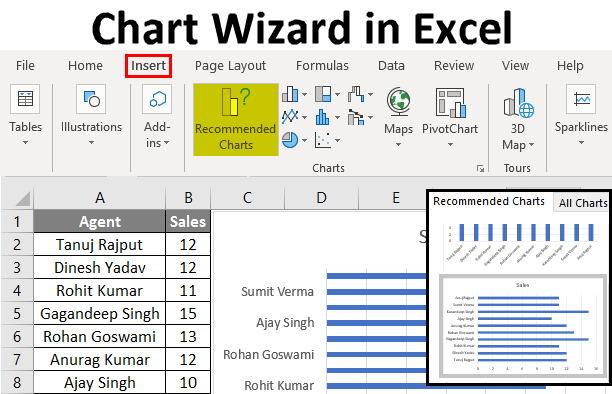
Chart Wizard in Excel

Chart Wizard in Excel

Chart Wizard in Excel is used to apply different charts, which can be Column, Bar, Pie, Areas, Line, etc. Now named Chart in the new version of MS Office, is available in the Insert menu tab. To create a chart in Excel, select data with at least one parameter that can be mapped, then from the Insert menu tab, select any chart type of choice. This will quickly create generate the Chart. We can even change the Chart’s color, add data labels, or a trend to make it more meaningful.

How to Use a Chart Wizard in Excel?

Let’s understand the working of it with the below simple steps.

You can download this Chart Wizard Excel Template here – Chart Wizard Excel Template

Example #1 – Create a Chart using Wizard

Using this Wizard, you can use any data to convert it into a chart. Let’s consider the below data table as shown in the below table and create a chart using Chart Wizard.

Create a Chart using Wizard Example 1.1

  • First, select the data from which you want to create the Chart, then go to the Insert tab and select Recommended Charts Tab.
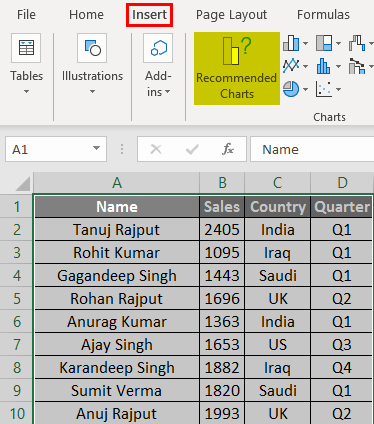
Create a Chart using Wizard Example 1.2

  • Select the Chart and then click on OK.

Create a Chart using Wizard Example 1.3

  • And the output will be as shown in the below figure:
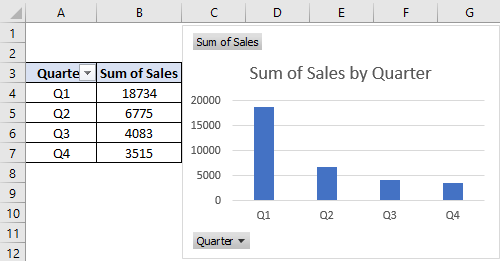
Create a Chart using Wizard Example 1.4

Example #2 – Create a Chart for Sales Data

Let’s consider the below data set as shown in the below table.
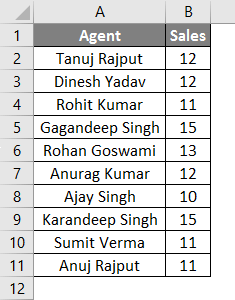
Create a chart for sales data Example 2.1

  • Select the sales data from which you want to create the Chart, then go to the Insert tab and select Recommended Charts Tab.
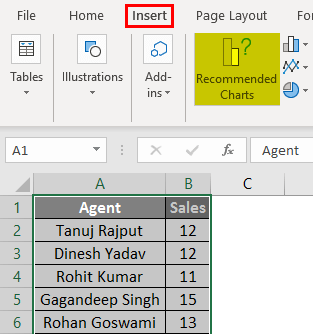
Create a chart for sales data Example 2.2

  • Select the Chart and then click on OK.
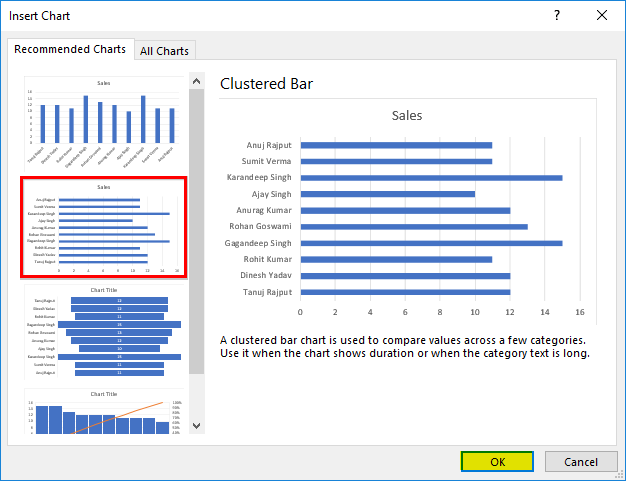
Create a chart for sales data Example 2.3

  • And the output will be as shown in the below figure:
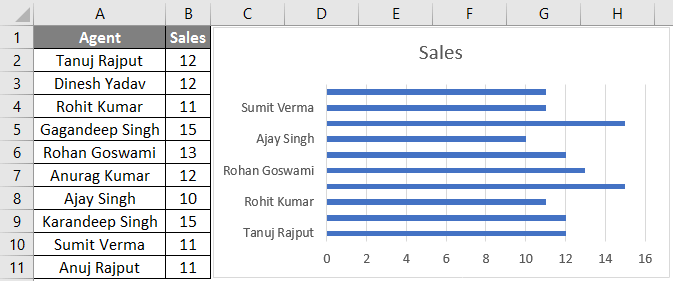
Create a chart for sales data Example 2.4

Example #3 – Create a Chart for Earning and Expenses Data

Let’s consider the below earning and expenses data set to create the Chart using chart wizard.
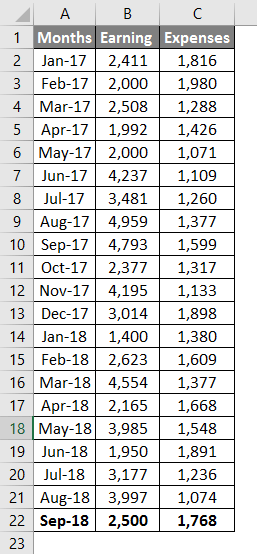
Create a chart for earning and expenses data Example 3.1

Here are the steps as follows:

  • First, select the data, then go to the Insert tab and select Recommended Chart Tab.

Create a chart for earning and expenses data Example 3.2

  • Pick any chart type, and then click OK.

Create a chart for earning and expenses data Example 3.3

  • And the output will be as shown in the below figure:
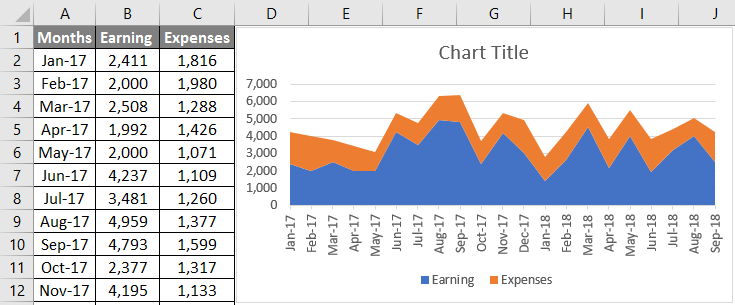
Create a chart for earning and expenses data Example 3.4

Example #4 – Create a Chart for Demand and supply Data

Let’s consider the below demand and supply data to create a chart using the chart wizard in Excel.
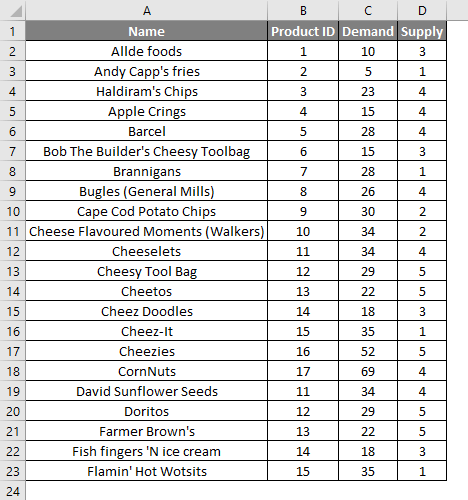
Chart Wizard Example 4.1

The steps are the same as in the previous examples; select the data below, then Go to the Insert tab and select Recommended Chart Tab.
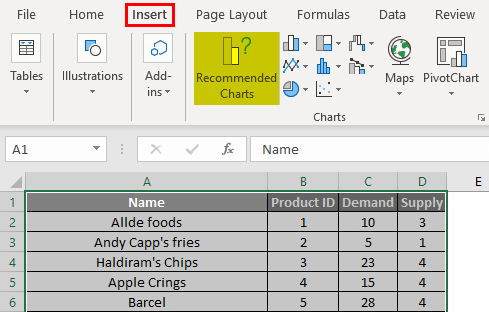
Chart Wizard Example 4.2

Select the Chart which you want to create, then click OK.
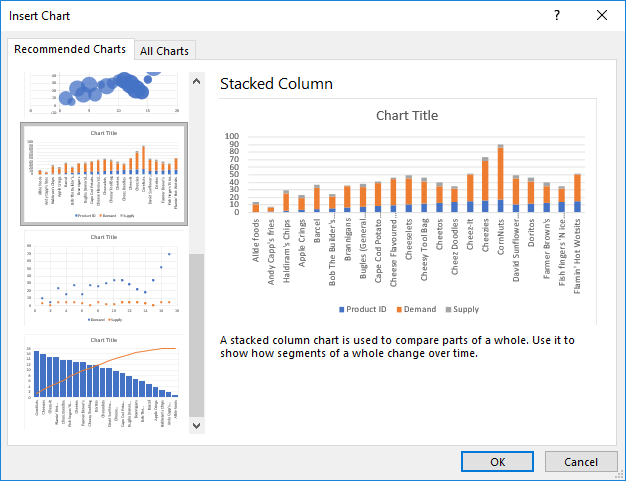
Chart Wizard Example 4.3

And the output will be as shown in the below figure: 
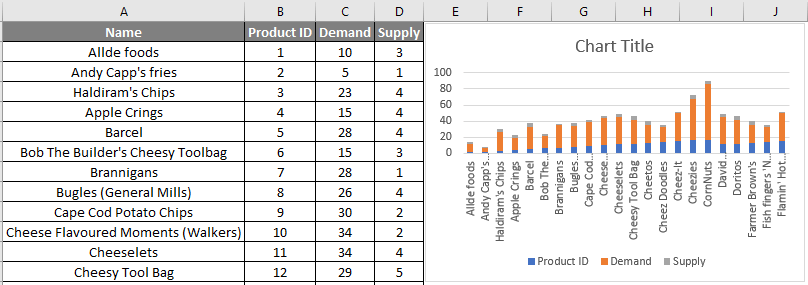
Chart Wizard Example 4.4

 Things to Remember

  • The Chart Wizard is simple and easy and is used to create an attractive chart using simple mouse clicks.
  • The Chart wizard provides simple steps to create complex charts.

Recommended Articles

This has been a guide to Chart Wizard. Here we discussed How to use a Chart Wizard in Excel, examples, and a downloadable Excel template. You may also look at these helpful Excel articles –

  1. Excel Stacked Bar Chart
  2. Excel Flowchart
  3. Marimekko Chart Excel
  4. Histogram Chart Excel
MICROSOFT POWER BI Course Bundle - 8 Courses in 1
34+ Hours of HD Videos
8 Courses
Verifiable Certificate of Completion
Lifetime Access
4.5
MS Excel & VBA for Data Science Course Bundle - 24 Courses in 1 | 10 Mock Tests
87+ Hours of HD Videos
24 Courses
10 Mock Tests & Quizzes
Verifiable Certificate of Completion
Lifetime Access
4.5
All-in-One Financial Analyst Masters Training Program Bundle - 550+ Courses | 300+ Mock Tests | 2000+ Hours | Lifetime |
2000+ Hours of HD Videos
43 Learning Paths
550+ Courses
Verifiable Certificate of Completion
Lifetime Access
4.9
All-in-One Data Science Bundle - 400+ Courses | 550+ Mock Tests | 2000+ Hours | Lifetime |
2000+ Hour of HD Videos
80 Learning Paths
400+ Courses
Verifiable Certificate of Completion
Lifetime Access
4.7
Primary Sidebar
Popular Course in this category
MS Excel Course Bundle - 36 Courses in 1 | 13 Mock Tests
 137+ Hours of HD Videos
36 Courses
13 Mock Tests & Quizzes
  Verifiable Certificate of Completion
  Lifetime Access
4.9
Price

View Course
Footer
About Us
  • Blog
  • Who is EDUCBA?
  • Sign Up
  • Live Classes
  • Certificate from Top Institutions
  • Contact Us
  • Verifiable Certificate
  • Reviews
  • Terms and Conditions
  • Privacy Policy
  •  
Apps
  • iPhone & iPad
  • Android
Resources
  • Free Courses
  • Excel Charts
  • Excel Tips
  • All Tutorials
Certification Courses
  • All Courses
  • Excel VBA Course - All in One Bundle
  • VBA Course
  • Excel Data Analysis Course
  • Excel for Marketing Course
  • Excel for Finance Course
  • Excel for HR Training

ISO 10004:2018 & ISO 9001:2015 Certified

© 2023 - EDUCBA. ALL RIGHTS RESERVED. THE CERTIFICATION NAMES ARE THE TRADEMARKS OF THEIR RESPECTIVE OWNERS.

EDUCBA

Download Chart Wizard Excel Template

Let’s Get Started

By signing up, you agree to our Terms of Use and Privacy Policy.

EDUCBA

*Please provide your correct email id. Login details for this Free course will be emailed to you

EDUCBA
Free Excel Course

Excel functions, formula, charts, formatting creating excel dashboard & others

By continuing above step, you agree to our Terms of Use and Privacy Policy.
*Please provide your correct email id. Login details for this Free course will be emailed to you

EDUCBA

*Please provide your correct email id. Login details for this Free course will be emailed to you
EDUCBA

*Please provide your correct email id. Login details for this Free course will be emailed to you
EDUCBA Login

Forgot Password?

By signing up, you agree to our Terms of Use and Privacy Policy.

EDUCBA

Download Chart Wizard Excel Template

EDUCBA

डाउनलोड Chart Wizard Excel Template

This website or its third-party tools use cookies, which are necessary to its functioning and required to achieve the purposes illustrated in the cookie policy. By closing this banner, scrolling this page, clicking a link or continuing to browse otherwise, you agree to our Privacy Policy

Loading . . .
Quiz
Question:

Answer:

Quiz Result
Total QuestionsCorrect AnswersWrong AnswersPercentage

Explore 1000+ varieties of Mock tests View more