Updated August 24, 2023
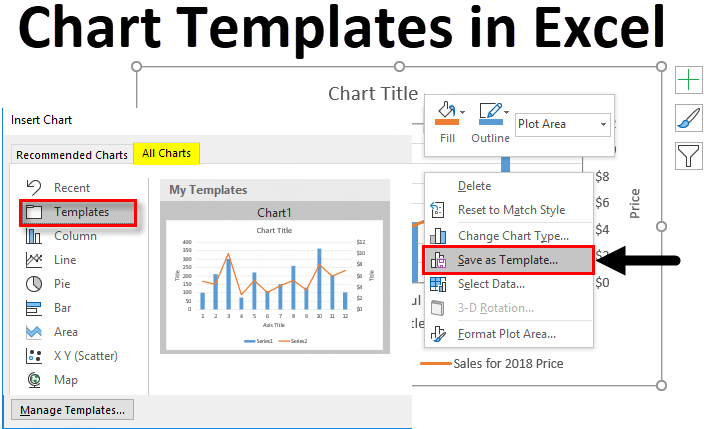
Chart Templates in Excel
The following article provides an outline for Chart templates in Excel. Pictures can communicate more than you do with words. This increases the visibility of the data that you want to present. This is the reason we use a chart or graph template with Excel. Instead of showing complicated data, a precise form of a chart is preferred. Excel provides a variety of options to deal with charts. The challenge is opting for the appropriate style, which perfectly matches the data you want to showcase.
A graph represents numerical data graphically. This may include symbols like a bar, lines, slices, etc. Apart from the built-in styles, excel offers customizable chart or graph templates.
How to Create a Chart or Graph Templates in Excel?
With the available styles, you can create a chart or graph, and if you want to make it as a template for further use, you can save the created graph as a template in Excel. This will help you to process the same kind of data further.
Below is an example of making a customized chart and save it as a template in Excel.
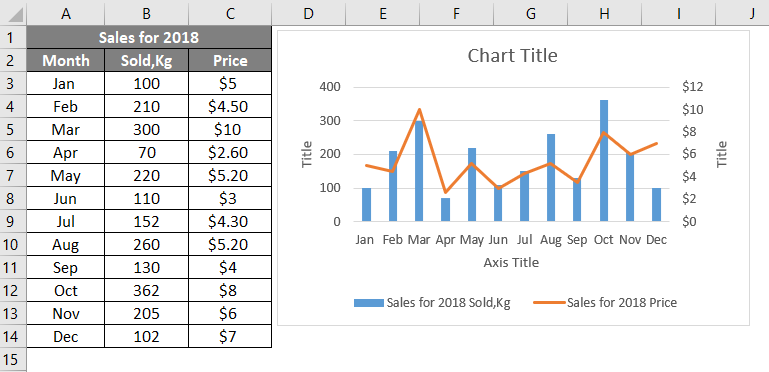
- It is given sales done for a year in different months. The sales are made in Kg, and the price is given.
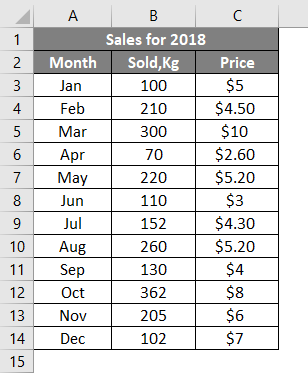
- By using this table, we need to create a graph. Here it contains the variables or components as Month, Unit sold, and Price. And we expect these three in the same graph.
- Select the entire data which you want to insert into the graph. Go to the Insert menu. Click on Recommended Charts.
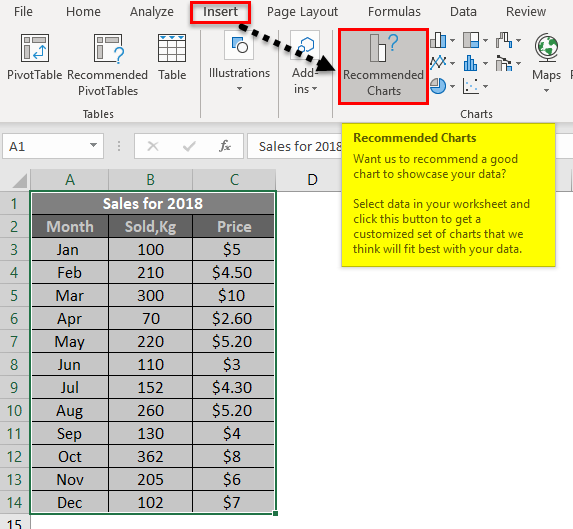
- Here you will get the customizable charts according to the data you want to represent.
- You will get two different tabs. Select All Charts from the pop-up window.
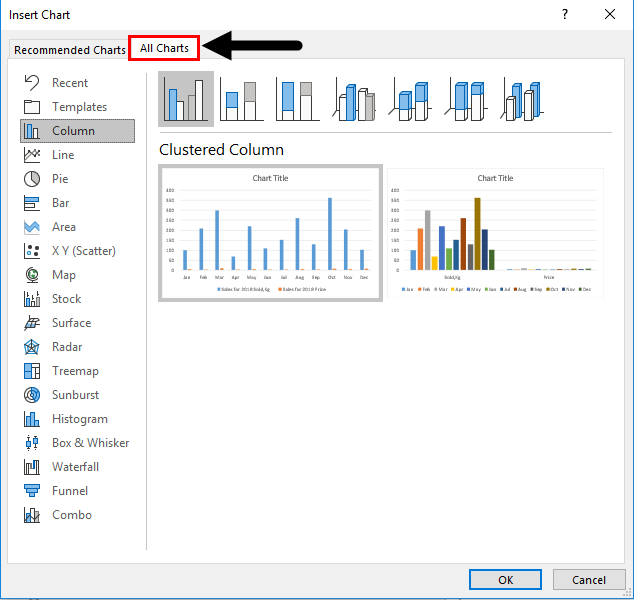
- Go to the Combo option.
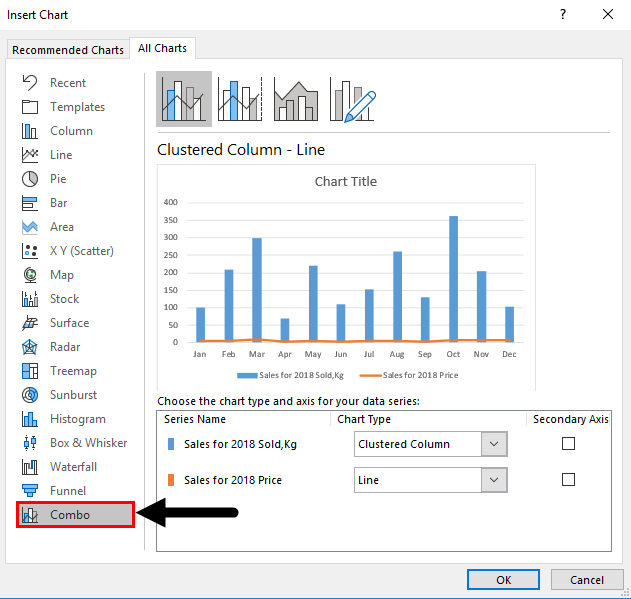
- You can select the pre-defined graphs to start quickly. You can see the built-in styles at the top of the dialog box.
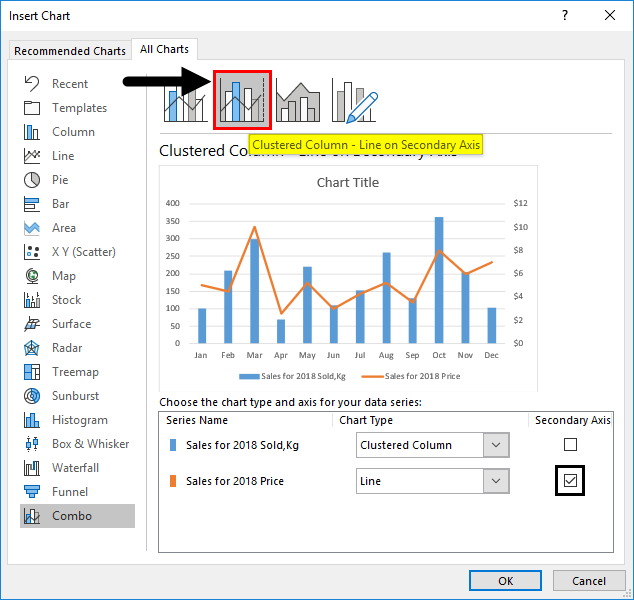
- Click on the second style Clustered Column – Line on the Secondary Axis. The given data (Qty, Price) have different scales and need a secondary axis to get a clear view of the data. So give a tick in the column you want to represent as a secondary axis. Click the OK button.
- The final chart will be as below.
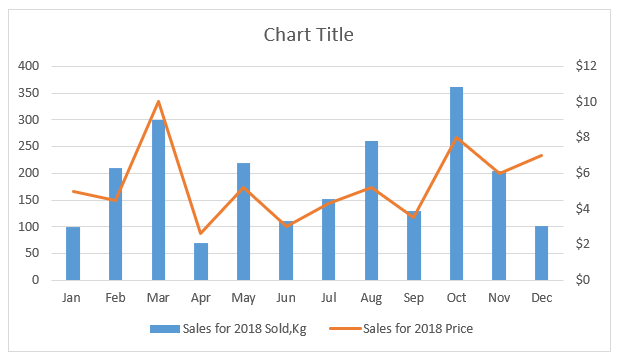
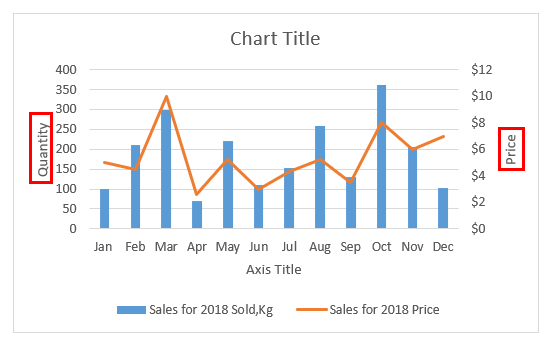
- The X-axis shows the months and Y as sales, and the secondary axis shows the month and sales price. This makes a perfect match for the data given in the table.
- To give more finishing touches, insert the axis titles. Click on the ‘+’ symbol. You will get the option to add Axis Titles; it will appear on each axis; double click on it and type the title you want.
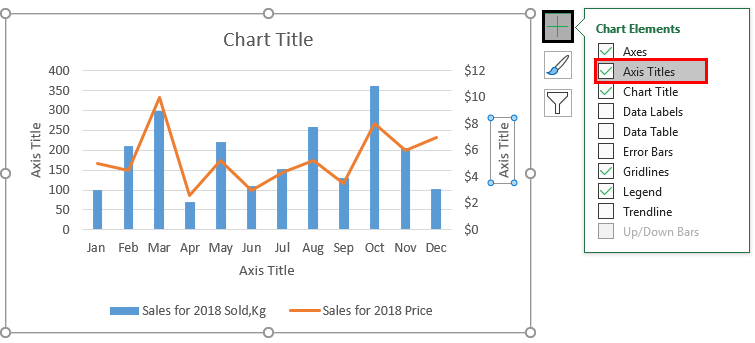
- The final view will be as below.
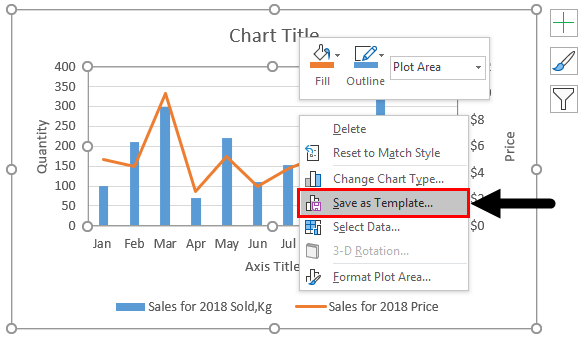
- To save this chart as a template right, click on the chart. Click on the Save as a Template.
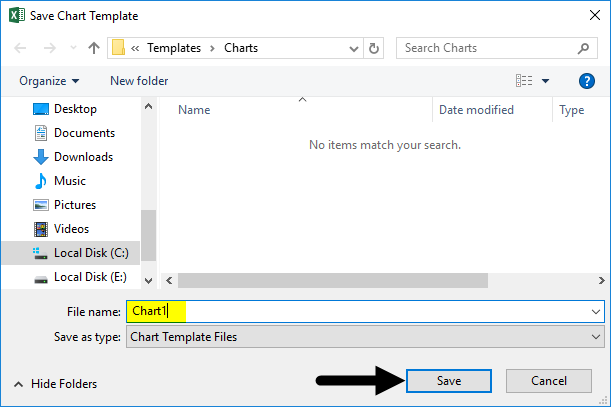
- You will get the dialog box to select the location where you want to save the chart Excel template. But to get it within Excel, I have saved the file in AppData\Microsoft\Templates\Charts, the default location for templates.
- Give any related name and click the Save button. The file will save as a .crtx file, which indicates a template file.
How to Use the Saved Chart Template in Excel?
Whenever you use the same type of data, you can use the saved templates to generate the chart in Excel.
- Once you select the column of data that you want to make as a graph, go to the Insert menu, then Recommended Charts.

- Click on the All Charts tab.

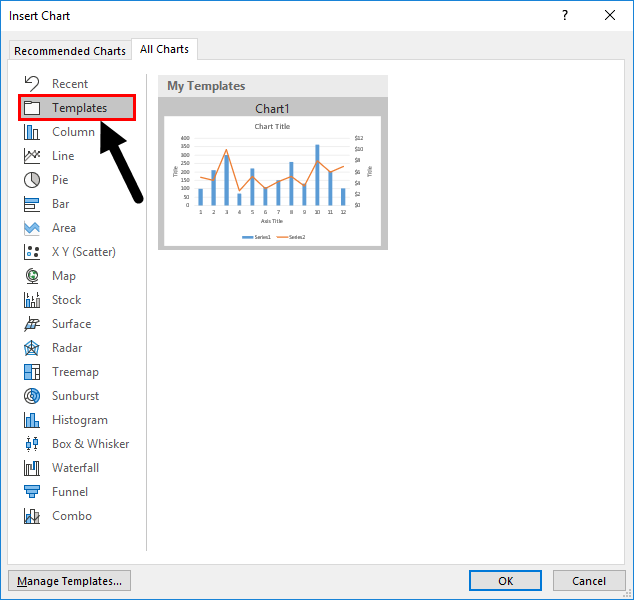
- You can see the below-listed. Select the Templates folder.

- Once you select the template folder, you will get the saved templates under My Templates. Select the template and click OK.
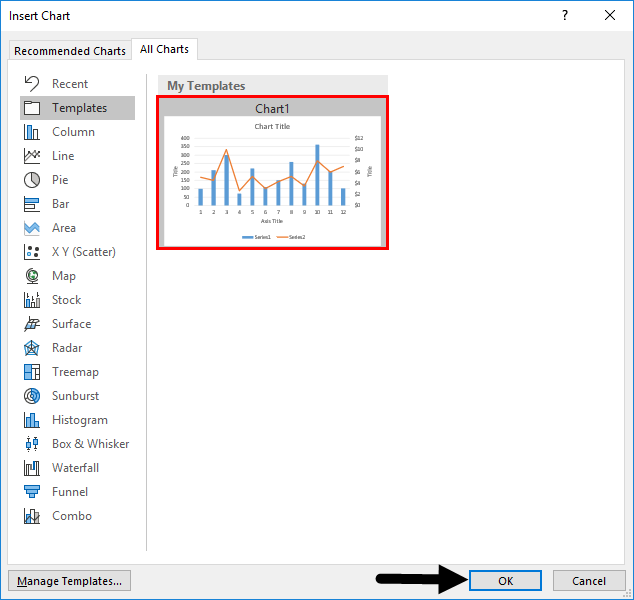
- You will get the same saved chart templates for your desired data.
How to Set a Default Chart Template in Excel?
The default chart type is a two-dimensional column chart in Excel. It is possible to set a saved template as your default chart.
- Select the data which you want to make as a graph. Go to the Insert menu, then Recommended Charts option.

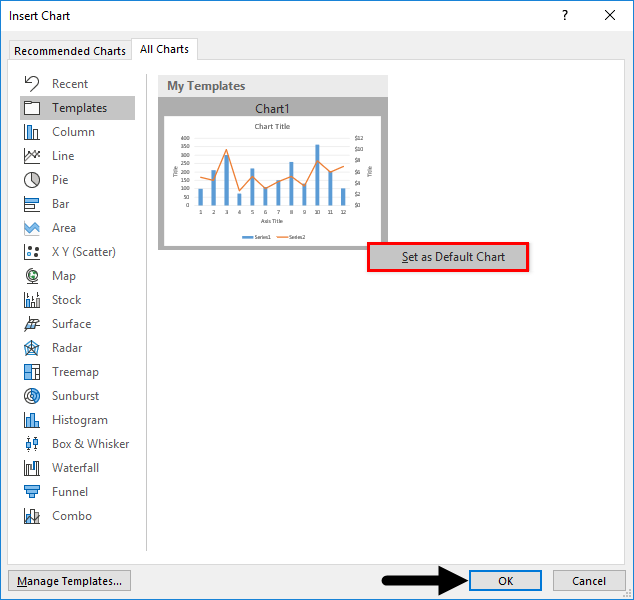
- If you click the Templates folder from the All Charts tab, the saved chart templates will be listed next to it.
- Right-click on any of the templates. Click on the Set as Default Chart pop-up, then press the OK button.
- Now the template has been set as the default template.
How to Delete a Chart Template in Excel?
If you no longer use a chart template, you can delete the template using Manage Templates.
- Select the Insert menu go to the Recommended Charts option.

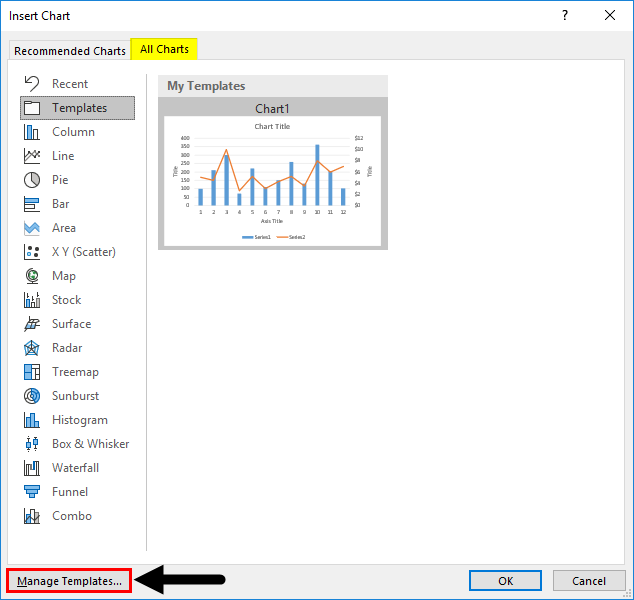
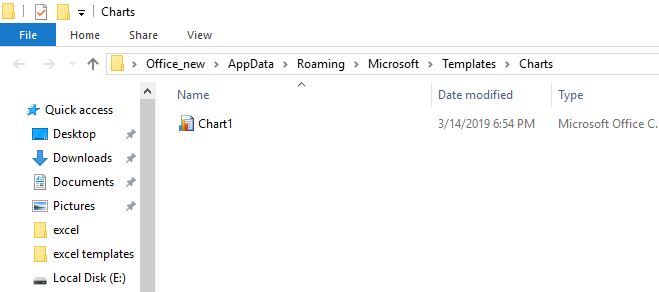
- Go to the All Charts tab. At the bottom of the dialog window, you can see a tab named Manage Templates. Click on the Manage Templates button.
- The default location of the saved templates will be opened. You can see the saved templates here.
- If you want to delete any of this, select the template and right-click on the template. From the pop-up, you can select the delete option. Click on Delete.
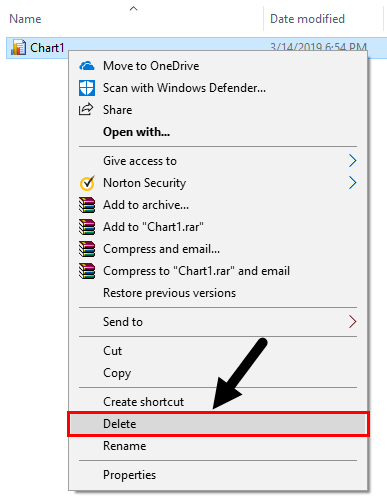
- Now the chart template will be deleted from the saved templates.
Things to Remember
- Graph templates help to represent your data in a pre-designed graph in Excel.
- If you use and generate the same chart type with different data sets daily, you can use the chart or graph templates in Excel.
- Any generated chart or graph can be saved as a template and used in Excel.
- Once you save the templates within the default location, it is possible to use them as a template with any other data.
- It is easy to manage the template; if you are no longer using it, you can delete it.
Recommended Articles
This has been a guide to Chart Templates in Excel. Here we discussed How to Create, Use, Delete, and Set a Default Chart or Graph Template in Excel, practical examples, and a downloadable Excel template. You may also look at these suggested articles –
