Updated July 26, 2023
Volatility Formula (Table of Contents)
What is Volatility Formula?
Volatility is the degree of variation of the returns for a given security or the market index over a given period. It is the measure of risk, and the standard deviation is the typical measure used to measure the volatility of any given stock.
At the same time, the other method can simply be the variance between returns from the same security or market index. One common measure of the volatility of given security with respect to the market index or the benchmark is its beta.
There can be two types of volatility depending on its usage – Implied Volatility is a forward-looking estimate used in the option pricing strategy. The other is Regular Volatility which is more common and uses a backward-looking real figure.
Degree of Volatility
High-security volatility would mean that with a slight change in the factors affecting the stock price, the security price can move drastically in either direction over a short period of time.
A lower volatility means that the value of a security does not react dramatically and tends to be steadier.
Calculation of Volatility of a Security
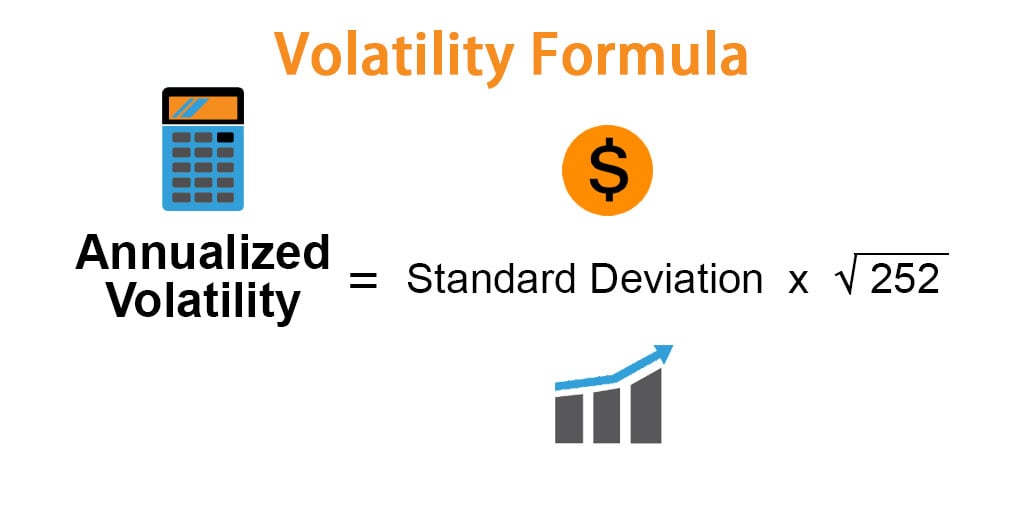
Formula For annualized volatility is given below,
assuming there are 252 trading days in a year. Standard Deviation is the degree to which the prices vary from the average over a given period of time.
For example: if the daily standard deviation of the S&P 500 benchmark is 1.73% in August 2015, its Annualized Volatility will be :
1.73 * √252 = 27.4
Therefore, the annualized volatility for the S&P 500 in 2015 was 27.4%, based on the daily volatility or daily price movements in August 2015.
How to Calculate the Standard Deviation
1. When you have a series of data points
- Calculate the average of the data set.
- Subtract the average from the actual observation to arrive at the deviation.
- Square up all the deviations and add them up to arrive at the Variance.
- Calculate the square root of the variance to arrive at the Standard Deviation.
2. Using MS-Excel
- Download the historical prices of given security – till the time period required.
- Calculate the daily returns, which is the percentage change each day compared to the previous day.
- Use the Excel function STDEV().
Example of Volatility Formula (With Excel Template)
Let’s take an example to understand the calculation of Volatility in a better manner.
Volatility Formula Example
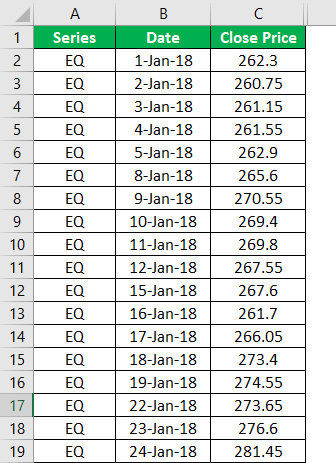
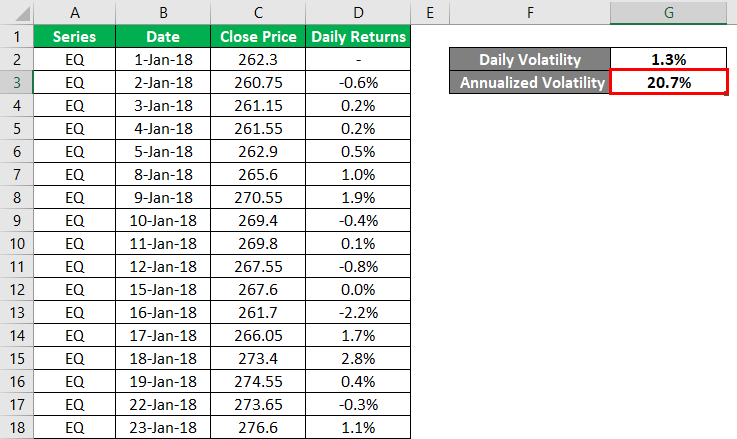
Consider calculating the Annualized Volatility of a given stock, ITC in this case.
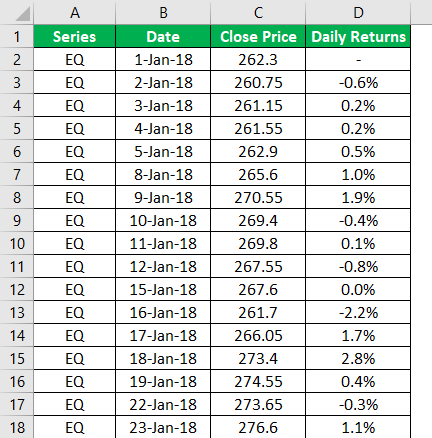
Below is the data of ITC for the time period January 2018 to December 2018. Calculate Daily returns, volatility, and annualized Volatility of ITC.
Solution:
We calculate the daily returns in column D here, using the close price mentioned in column C.
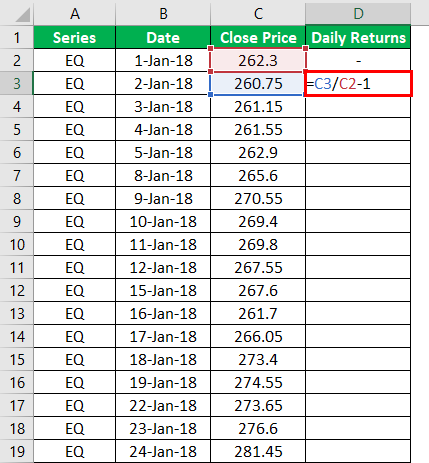
So the result will be as given below.
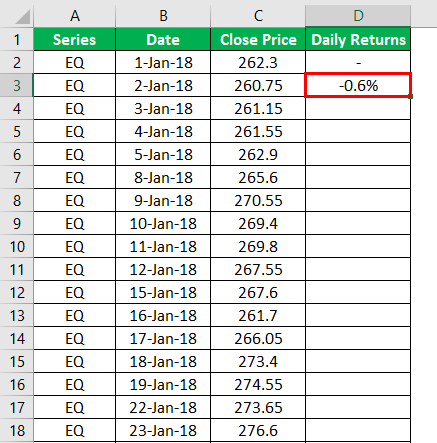
Similarly, calculate daily returns for all the remaining cells.
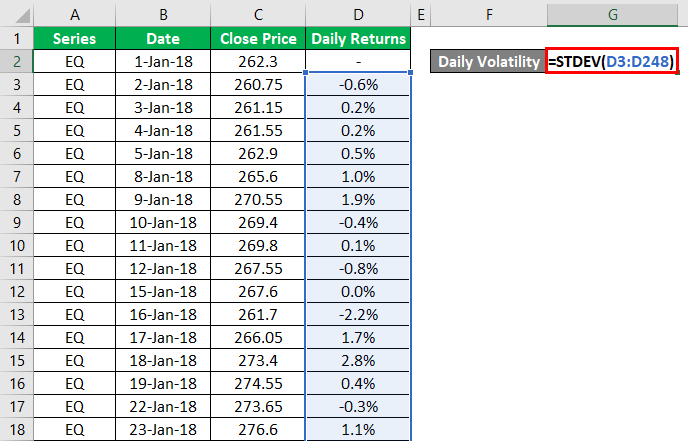
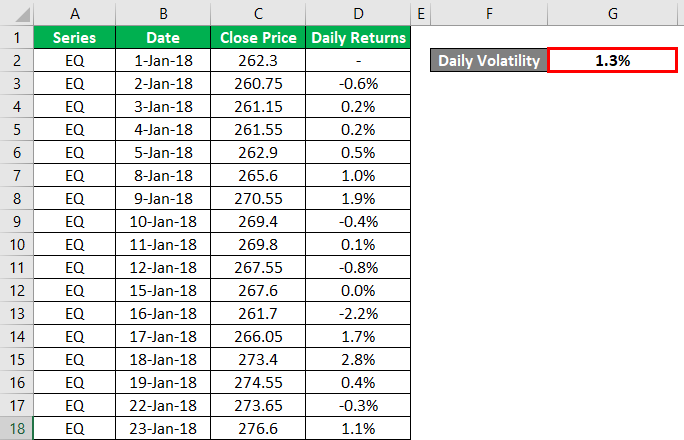
Daily Volatility can be calculated using the Standard Deviation or STDEV() formula in MS Excel.
The output will be as given below.
Annualized Volatility is calculated using the formula given below
Annualized Volatility = Standard Deviation * √252
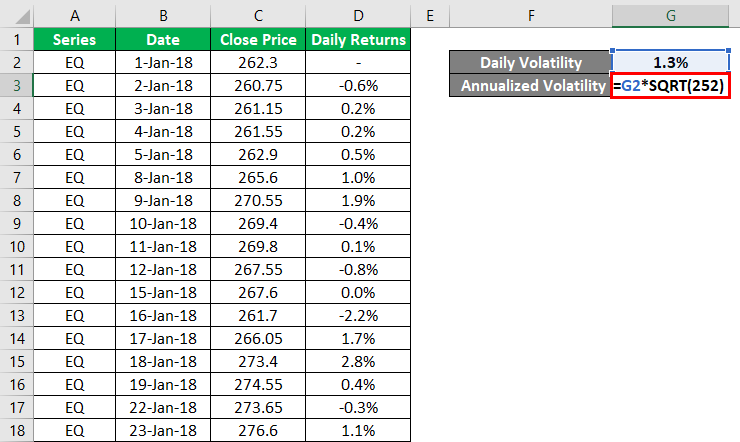
The output of Annualized Volatility will be as shown below.
Relevance and Uses of Volatility
Traditionally, it is an assumption or general phenomenon that the risk frameworks that use standard deviation as the key method assume that the returns conform to a normal bell-shaped distribution. This gives us a fixed risk and returns framework, and if the returns in the curve do not show a symmetrical behavior, the investors tend to panic.
Another use of the volatility numbers is trading on security and deciding on the stop-loss point. The knowledge of stock as to how much it will move within a stipulated time can help the investor decide on the stop loss instead of facing the losses due to the random fluctuations in the stock price.
Understanding volatility and knowing its applications can act as a double-edged sword. When a highly volatile stock can land you into huge losses, when you are hitting the right market timing, you can even mint large profits. It undoubtedly reduces your expected long-term return, but it provides you with equal chances to make a few big gains.
Volatility Formula Calculator
You can use the following Volatility Calculator
| Standard Deviation | |
| Annualized Volatility | |
| Annualized Volatility = | Standard Deviation x √252 |
| = | 0 x √252 = 0 |
Recommended Articles
This is a guide to the Volatility Formula. Here we discuss How to Calculate Volatility along with practical examples. We also provide a Volatility Calculator with a downloadable Excel template. You may also look at the following articles to learn more –
