Charts in Excel VBA
Visualization is very important in any data. In excel, when we present data in tables and pivot, it might be hard for another user to understand the main scenario from the data. So in excel, we have charts to present our data. Charts is the visual representation of data present in rows and columns of the excel sheet. Now we all know how to insert a chart in an excel worksheet. In this topic, we will learn about using charts in VBA. It is as simple as we use charts in excel. Now, like in a worksheet where we have various types of charts to opt for, similarly, we have all the charts in VBA also as an object. All we need to do is call that object in order to use it. We can make charts from VBA in the same worksheet or in a separate chart sheet. However, it is most advisable to use charts in a separate sheet to avoid any confusion.
Now, what are the charts in VBA? Charts are simple objects in VBA. We can make two types of charts in VBA. One is known as a chart sheet, while another is known as Embedded charts. In the chart sheet, VBA creates a new worksheet for the chart. We give the reference data which is another worksheet, as source data. Now embedded charts are those charts which are present in the same worksheet of the data. Now the coding for these two types of charts is slightly different from one another, which we will learn in this topic. To use the chart properties in VBA, we use the dot (.) symbol as IntelliSense. Now we need to remember one thing that there are various types of charts in excel. If we do not provide a chart type to our code, VBA automatically makes a column chart for us by default. Obviously, we can change that by a few lines of code.
How to Create Charts in Excel VBA?
Now let us learn how to make charts in Excel VBA with a few examples.
For all the examples, we will consider one data which is present in sheet 1 as follows,
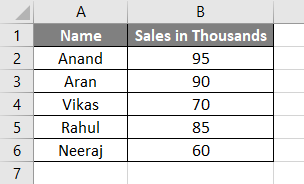
Excel VBA Charts – Example #1
First, let us learn how to insert a chart in VBA; for this, follow the below steps:
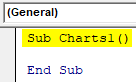
Step 1: Start with a subprocedure as follows.
Code:
Sub Charts1()

End Sub
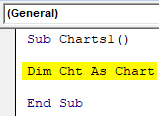
Step 2: Declare one variable as a chart object.
Code:
Sub Charts1()

Dim Cht As Chart

End Sub
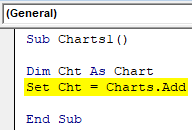
Step 3: In order to use the charts, we need to call the add method as shown below.
Code:
Sub Charts1()

Dim Cht As Chart
Set Cht = Charts.Add

End Sub
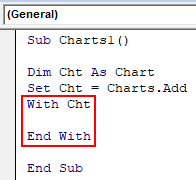
Step 4: To use chart object properties, insert a With Statement in the code as shown below.
Code:
Sub Charts1()

Dim Cht As Chart
Set Cht = Charts.Add
With Cht

End With

End Sub
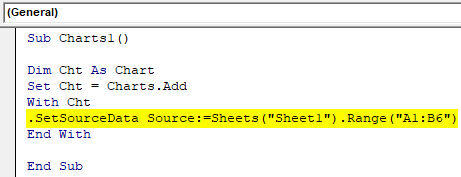
Step 5: Now, let us provide a source to this chart; start with a dot operator, and it will give us further options. Write the following code below to enter a source for the chart.
Code:
Sub Charts1()

Dim Cht As Chart
Set Cht = Charts.Add
With Cht
.SetSourceData Source:=Sheets("Sheet1").Range("A1:B6")
End With

End Sub
Step 6: Now, remember we have not provided any chart type; first, let us run the above code by pressing the F5 key and see what type of chart will be inserted.
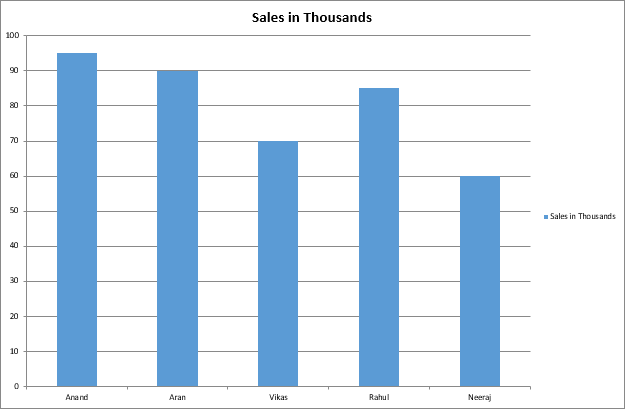
We have a new sheet created called a Chart, and it has our chart in it.
Step 7: Now, let us give the code the type of chart we want to use for this representation,
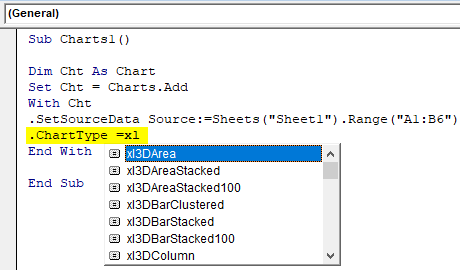
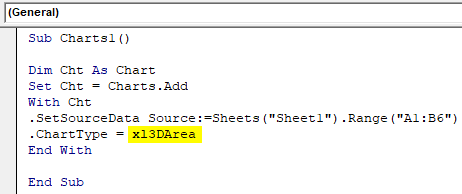
Step 8: Let us select a 3D area for this example as shown below,
Code:
Sub Charts1()

Dim Cht As Chart
Set Cht = Charts.Add
With Cht
.SetSourceData Source:=Sheets("Sheet1").Range("A1:B6")
.ChartType = xl3DArea
End With

End Sub
Step 9: Run the code by pressing the F5 key or by clicking on the Play button and check the chart type in the worksheet.
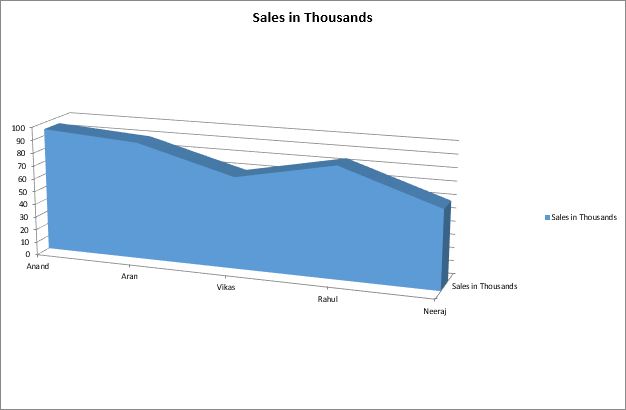
Now, remember every time we run the code, it will create a new chart sheet for us. This is also known as a chart sheet because it creates charts in another sheet.
Excel VBA Charts – Example #2
Now let us make an Embedded chart which means a chart in the sheet of the source data. For this, follow the below steps to create a chart in Excel VBA.
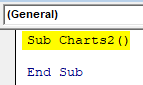
Step 1: In the same module, start another subprocedure as follows.
Code:

Sub Charts2()

End Sub
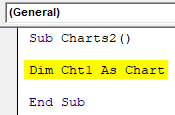
Step 2: Again, declare a variable as chart type as follows.
Code:
Sub Charts2()

Dim Cht1 As Chart

End Sub
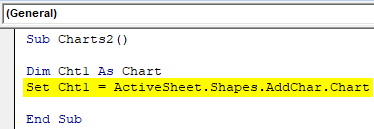
Step 3: The difference in the embedded charts is we refer to the worksheet, which has the data as the active sheet by the following code shown below.
Code:
Sub Charts2()

Dim Cht1 As Chart
Set Cht1 = ActiveSheet.Shapes.AddChart.Chart

End Sub
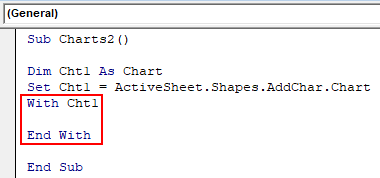
Step 4: Now the rest part of the making and designing the charts are similar, we again put a With Statement in the code as follows.
Code:
Sub Charts2()

Dim Cht1 As Chart
Set Cht1 = ActiveSheet.Shapes.AddChart.Chart
With Cht1

End With

End Sub
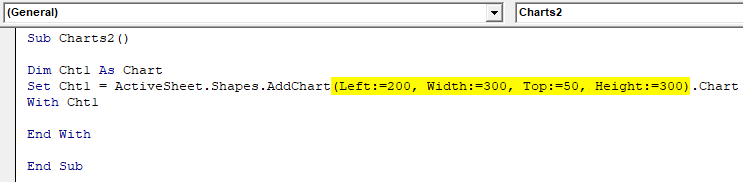
Step 5: Let us specify a location where our chart is going to be as we do not want it to be over our data, so before With Statement, add the following code to where we had set our chart as follows.
Code:
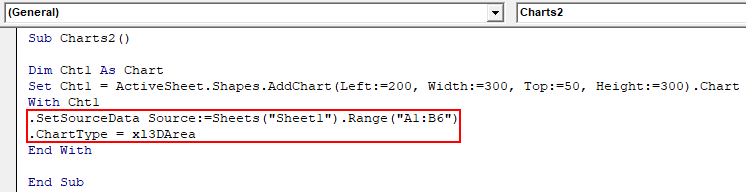
Sub Charts2()

Dim Cht1 As Chart
Set Cht1 = ActiveSheet.Shapes.AddChart(Left:=200, Width:=300, Top:=50, Height:=300).Chart
With Cht1

End With

End Sub
Step 6: Now, let us provide the source of the data and chart type we want to be as follows.
Code:
Sub Charts2()

Dim Cht1 As Chart
Set Cht1 = ActiveSheet.Shapes.AddChart(Left:=200, Width:=300, Top:=50, Height:=300).Chart
With Cht1
.SetSourceData Source:=Sheets("Sheet1").Range("A1:B6")
.ChartType = xl3DArea
End With

End Sub
Step 7: Run the code by pressing the F5 key or by clicking on the Play button and see the result in our sheet where the data is as follows.
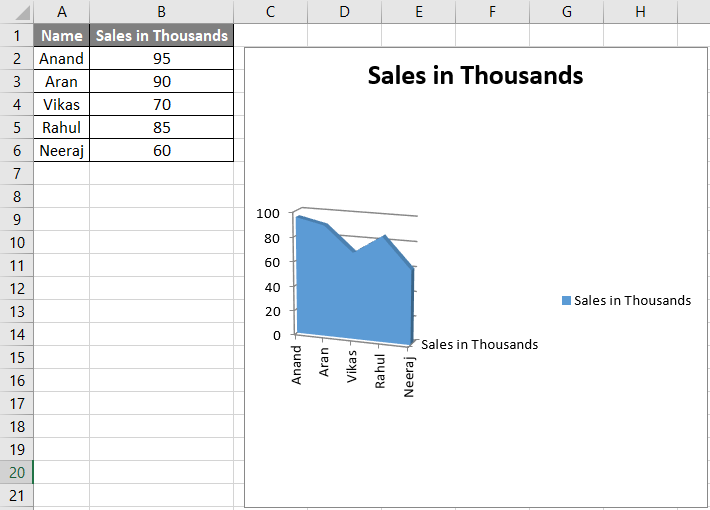
This is called an embedded chart as the chart is in the same sheet as the data.
Excel VBA Charts – Example #3
There is also another way to create a chart in our worksheets using VBA. This method is known as the ChartsObject method.
Step 1: In the same module, let us start with a third subprocedure as follows.
Code:
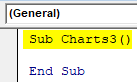
Sub Charts3()

End Sub
Step 2: Cone as worksheet data type, another as range and one as chart object as shown below.
Code:
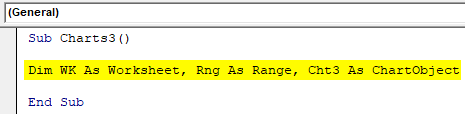
Sub Charts3()

Dim WK As Worksheet, Rng As Range, Cht3 As ChartObject

End Sub
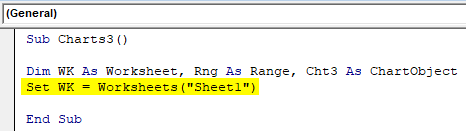
Step 3: First, set the worksheet to where the data is in, which is sheet 1 in this case.
Code:
Sub Charts3()

Dim WK As Worksheet, Rng As Range, Cht3 As ChartObject
Set WK = Worksheets("Sheet1")

End Sub
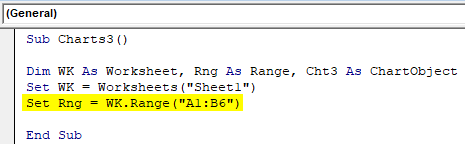
Step 4: Now, select the range of data we have as follows.
Code:
Sub Charts3()

Dim WK As Worksheet, Rng As Range, Cht3 As ChartObject
Set WK = Worksheets("Sheet1")
Set Rng = WK.Range("A1:B6")

End Sub
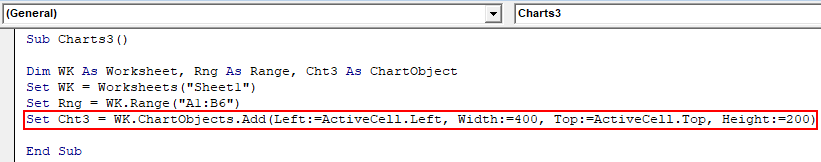
Step 5: Now, set the chart object to add the chart using the chart object property as follows.
Code:
Sub Charts3()

Dim WK As Worksheet, Rng As Range, Cht3 As ChartObject
Set WK = Worksheets("Sheet1")
Set Rng = WK.Range("A1:B6")
Set Cht3 = WK.ChartObjects.Add(Left:=ActiveCell.Left, Width:=400, Top:=ActiveCell.Top,
 Height:=200)

End Sub
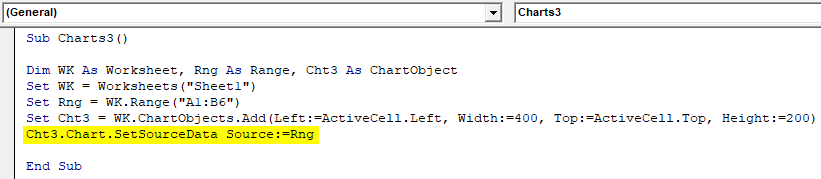
Step 6: Now, let us give the source to the chart as follows.
Code:
Sub Charts3()

Dim WK As Worksheet, Rng As Range, Cht3 As ChartObject
Set WK = Worksheets("Sheet1")
Set Rng = WK.Range("A1:B6")
Set Cht3 = WK.ChartObjects.Add(Left:=ActiveCell.Left, Width:=400, Top:=ActiveCell.Top,
 Height:=200)
Cht3.Chart.SetSourceData Source:=Rng

End Sub
Step 7: Now select the chart type we want similarly as follows.
Code:
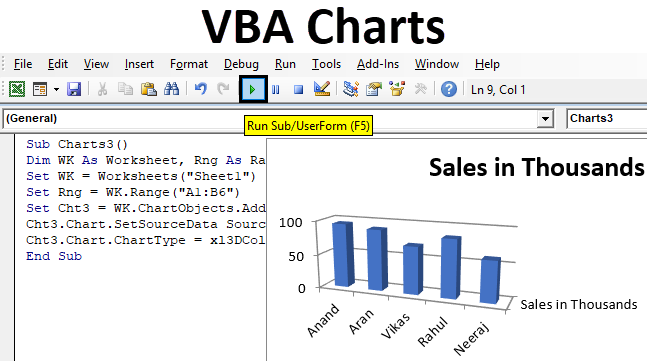
Sub Charts3()

Dim WK As Worksheet, Rng As Range, Cht3 As ChartObject
Set WK = Worksheets("Sheet1")
Set Rng = WK.Range("A1:B6")
Set Cht3 = WK.ChartObjects.Add(Left:=ActiveCell.Left, Width:=400, Top:=ActiveCell.Top,
 Height:=200)
Cht3.Chart.SetSourceData Source:=Rng
Cht3.Chart.ChartType = xl3DColumn

End Sub
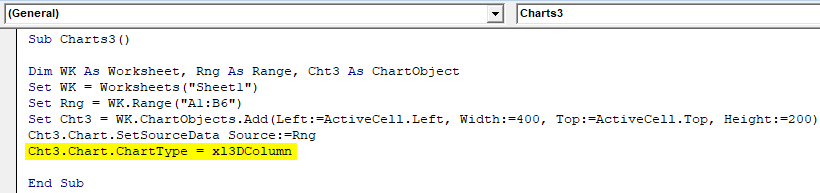
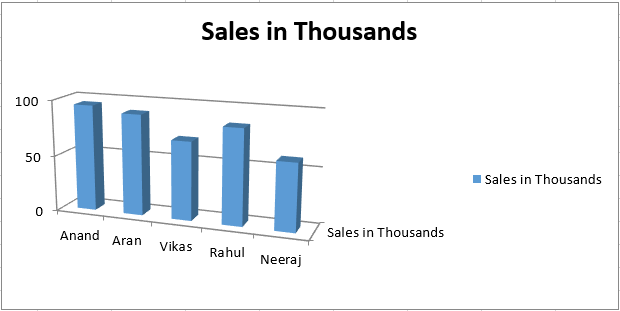
Step 8: Run the code by pressing the F5 key or by clicking on the Play button and see the result in sheet 1.
Things to Remember
- We can decide which type of charts we want to use by setting a chart type.
- In Chart type, the number of times we run the code, a new worksheet is created under a unique chart name with a chart in it.
- Chart object is also a member of sheets in which we have both charts and sheets.
- To use the chart object, we need to use a SET statement to set the chart first.
Recommended Articles
This is a guide to VBA Charts. Here we discuss how to create Charts in Excel using VBA code along with practical examples and a downloadable excel template. You can also go through our other suggested articles –
