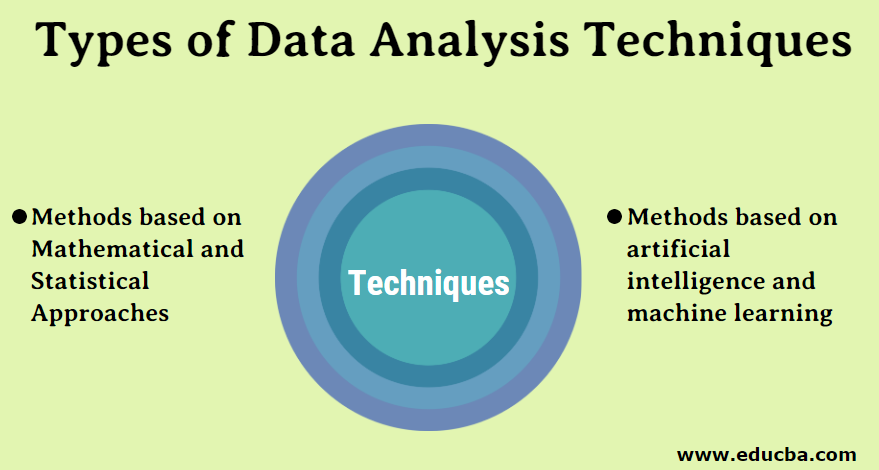
Introduction to Data Analysis Techniques
Data analysis means examining, cleaning, and organizing data to find useful information and insights. Organizations use data analysis techniques to discover patterns, make predictions, and support better decision-making.
These techniques generally fall into two categories: mathematical and statistical approaches and methods based on machine learning and artificial intelligence.
Important Types of Data Analysis Techniques
Data analysis techniques are broadly classified into two types: they are
- Methods based on Mathematical and Statistical Approaches
- Methods based on artificial intelligence and machine learning.
Mathematical and Statistical Approaches
1. Descriptive Analysis
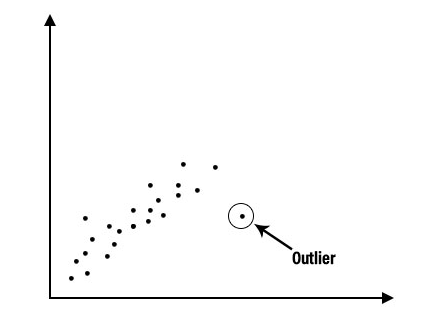
Descriptive analysis is the first step in statistical data analysis. It summarizes and organizes data to help analysts understand its basic structure. This technique identifies patterns, detects outliers, and highlights relationships between variables.
Descriptive analysis is often divided into:
- Analysis of individual variables (mean, median, mode)
- Analysis of relationships between variables (correlation, cross-tabulation).
It prepares data for more advanced statistical techniques.
2. Regression Analysis
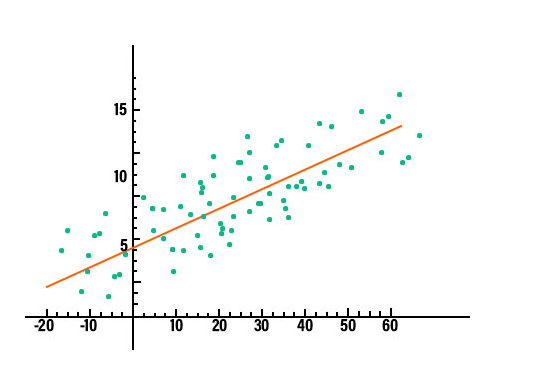
Regression analysis shows how one variable depends on others. Analysts use it to understand how changes in one variable affect another and to make predictions.
Common regression models include:
- Linear regression
- Logistic regression
- Multiple regression
Regression analysis helps organizations forecast trends, assess risks, and support business analytics.
3. Dispersion Analysis
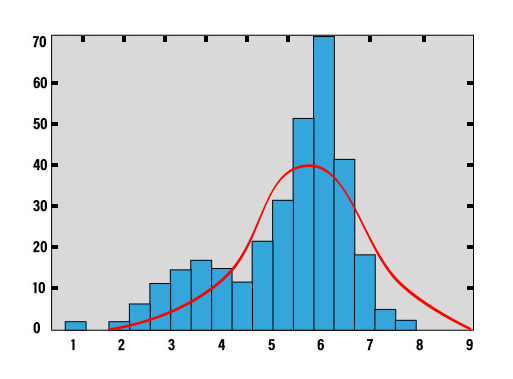
Dispersion analysis measures how spread out the data values are around the average. Low dispersion indicates that data points are close to the mean, whereas high dispersion indicates greater variability.
Common measures of dispersion include:
- Variance
- Standard deviation
- Interquartile range (IQR)
This technique helps assess data consistency and reliability.
4. Factor Analysis
Factor analysis identifies underlying variables, known as factors, that explain patterns within a dataset. It reduces data complexity by grouping related variables.
This technique usually comes first in:
- Clustering
- Classification
- Data dimensionality reduction.
Factor analysis is related to Principal Component Analysis (PCA), but PCA is a more basic exploratory method.
5. Time Series
Time series analysis studies data recorded at regular time intervals. It helps identify trends, seasonal patterns, and long-term movements.
Businesses commonly use time series analysis for:
- Sales forecasting
- Stock market prediction
- Weather and economic trend analysis.
Methods based on Machine Learning and Artificial Intelligence
1. Decision Trees
Decision tree analysis is a graphical representation, similar to a tree structure, in which decision problems are depicted as a flowchart, with branches for alternative outcomes. Decision trees are a top-down approach type, with the first decision node at the top. Based on the answer at the first decision node, the tree branches, and the process continues until it reaches a final decision. The branches that no longer divide are known as leaves.
2. Neural Networks
Neural networks are algorithms designed to mimic the human brain. It is also known as the “Network of Artificial neurons”. The applications of neural networks in data mining are very broad. They exhibit high robustness to noise and high accuracy. Depending on the application, various types of neural networks are currently used; among them are recurrent and convolutional neural networks. Convolutional neural networks are mostly used in Image processing, natural language processing, and recommender systems. Recurrent neural networks are mainly used for handwriting and speech recognition.
3. Evolutionary Algorithms
Evolutionary algorithms use the mechanisms inspired by recombination and selection. These algorithms are domain-independent and can explore large datasets, discovering patterns and solutions. They are less sensitive to noise than other data techniques.
4. Fuzzy logic
It is an approach in computing based on “Degree of truth” rather than the common “Boolean logic” (truth/false or 0/1). As discussed above in decision trees, at a decision node, we have either yes or no as the answer. What if we have a situation where we can’t decide an absolute yes or an absolute no? In these cases, fuzzy logic plays an important role. It is a diverse, valued logic in which the truth value can lie between completely true and completely false; that is, it can take any real value between 0 and 1. Fuzzy logic is applicable when there is significant noise in the data.
When to Use Each Data Analysis Technique?
| Technique | Best Used When |
| Descriptive Analysis | You want to summarize or understand past data |
| Regression Analysis | You need to predict outcomes or find relationships |
| Dispersion Analysis | You want to measure data variability |
| Factor Analysis | You need to reduce variables or find hidden patterns |
| Time Series Analysis | You analyze trends over time |
| Decision Trees | You need clear, explainable decisions |
| Neural Networks | You work with large, complex datasets |
| Fuzzy Logic | You deal with uncertainty or vague data |
Real-World Applications of Data Analysis Techniques
Data analysis goes beyond theory; it drives decisions and innovation in almost every industry. Analyzing data helps organizations improve performance, serve customers, and grow. Some key real-world applications include:
1. Business Intelligence and Decision-Making
Companies use descriptive and regression analysis to understand sales trends, customer behavior, and market performance. For example, retailers analyze purchase patterns to optimize inventory levels and forecast demand.
2. Financial Services
Banks and investment firms rely on statistical models and time-series analysis to predict stock price movements, detect fraud, and manage risk. Machine learning methods, such as neural networks, can detect anomalous transactions or patterns that may indicate fraud.
3. Healthcare and Medical Research
Data analysis helps diagnose diseases, personalize treatments, and predict outbreaks. Hospitals use predictive analytics to plan patient care, and researchers study large datasets to identify associations between genetics, lifestyle, and disease.
4. Marketing and Customer Insights
Companies use clustering and factor analysis to segment customers based on preferences, behavior, and demographics. This enables targeted campaigns, personalized recommendations, and higher conversion rates.
5. Manufacturing and Supply Chain Optimization
Time series analysis and AI models help monitor equipment health, predict maintenance needs, and streamline supply chains. This reduces downtime, cuts costs, and improves production efficiency.
6. Transportation and Smart Cities
Governments and transport companies analyze traffic data, commuter patterns, and public transit usage. This enables more effective urban planning, optimized routing, and reduced congestion.
7. Sports and Performance Analytics
Teams and coaches leverage data analysis to evaluate player performance, develop strategies, and prevent injuries. Wearable technology and sensor data feed into machine learning models to gain competitive advantages.
8. Environmental Monitoring and Sustainability
Analysts track climate data, pollution levels, and resource usage to model environmental trends, predict natural disasters, and implement sustainable practices. AI and fuzzy logic models help interpret complex ecological data.
By integrating these techniques into practical scenarios, organizations can not only improve efficiency but also anticipate future trends and make proactive decisions.
Final Thoughts
The difficult question that all corporations face is which data analysis technique is best for them? We cannot define any technique as the best; instead, we can evaluate multiple techniques, identify the one that best fits our dataset, and use it. The aforementioned techniques are among the most important currently used in industry.
Frequently Asked Questions (FAQs)
Q1. Can small businesses benefit from data analysis?
Answer: Yes. Even small datasets can provide insights for customer behavior, sales trends, and operational efficiency, helping businesses make informed decisions.
Q2. What is the role of data cleaning in data analysis?
Answer: Data cleaning removes errors, duplicates, and inconsistencies. Clean data ensures accurate results and reliable insights from any analysis technique.
Q3. Are neural networks suitable for beginners in data analysis?
Answer: Neural networks require more computational resources and expertise, so beginners usually start with descriptive analysis or regression before moving to advanced AI techniques.
Q4. Can data analysis predict the future?
Answer: It cannot predict the future with certainty, but techniques such as regression and time-series analysis can forecast trends and support proactive planning.
Q5. Do I need programming skills for data analysis?
Answer: Yes, developers use programming languages like Python or R to implement statistical and machine learning techniques efficiently, while beginner-friendly tools provide drag-and-drop interfaces.
Q6. How can I validate if my data analysis results are correct?
Answer: Validation involves checking assumptions, using statistical tests, comparing predictions with actual results, and cross-verifying with multiple techniques to ensure accuracy.
Recommended Articles
This is a guide to data analysis techniques. Here, we discuss the Types of data analysis techniques currently used in industry. You may also have a look at the following articles to learn more:

