Updated March 24, 2023
Introduction to Tableau Window Functions
Tableau’s versatility as a BI tool is proven by many of its capabilities. One such capability is the functionality of Windows functions. Windows functions are those functions that allow us flexibility while working with data calculations. What these functions do is similar to the operations performed by the OFFSET function in Excel. These functions truly enhance Tableau’s capability as a BI tool. Though they work along similar lines, in order to understand the application of Windows functions, each of them must be experimented in different contexts.
Working with Window Functions in Tableau
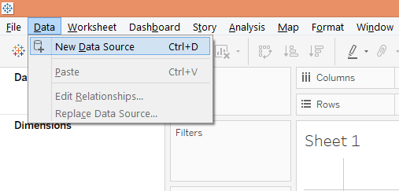
1. First load the dataset. For that click on “New Data Source” under Data Menu as shown below.
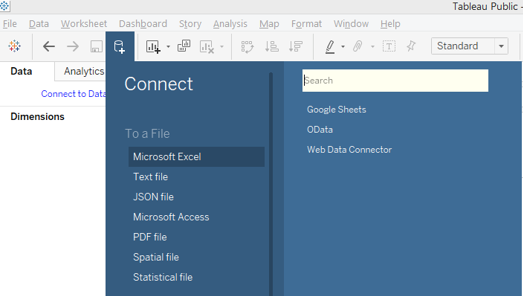
2. In the Connect section select the requisite data source type. In this case, it is clicked on “MS Excel”, so click on “Microsoft Excel” as shown below.
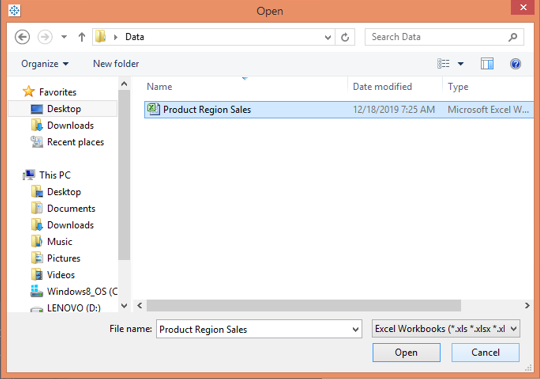
3. Select the requisite Excel file from the location it is stored at and open it to load into Tableau as illustrated below.
4. When the above steps are followed properly, the data gets loaded into Tableau and can be seen in the Data tab.
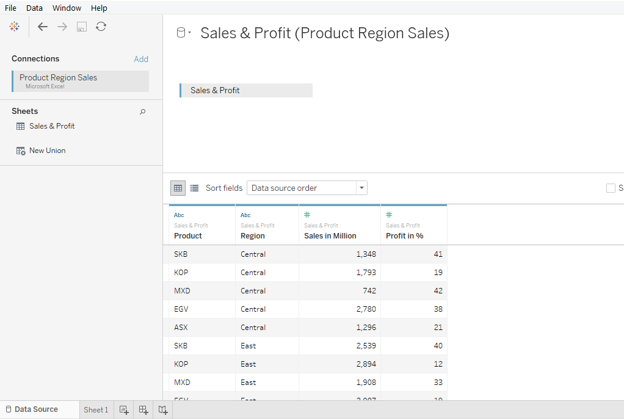
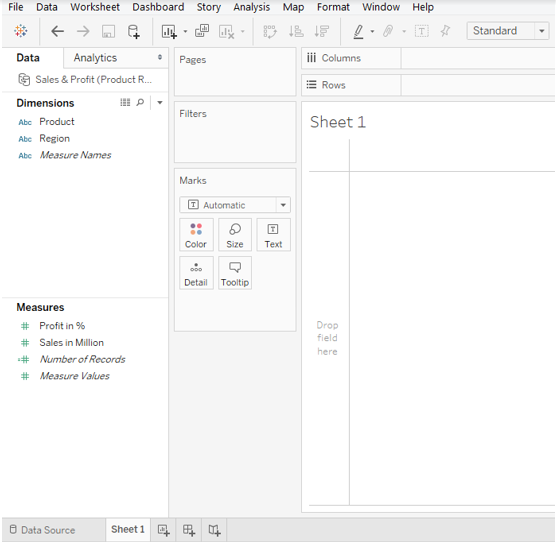
5. The requisite dimensions and measures in the dataset can be seen in the respective sections. This is as shown below.
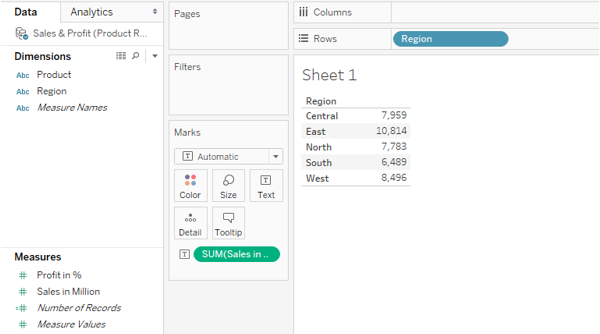
6. To begin with, bring region dimension into Rows region and drag ‘Sales in Million’ measure over Text in marks card. We get a table giving region-wise sales as can be seen in the below image.
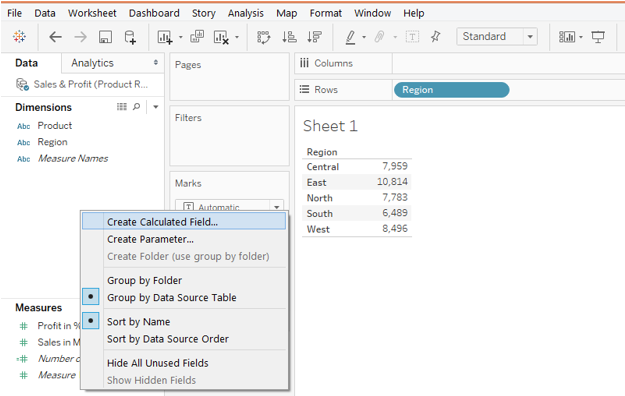
7. In order to demonstrate the application of Windows functions, we first need to create a calculated field. Now, right-click anywhere in the blank space under the Data tab. In the pop-menu, click on “Create Calculated Field” as illustrated in the following image.
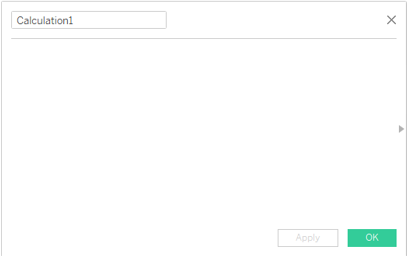
8. When we follow the above step, we are navigated to the calculated field pane, as shown below.
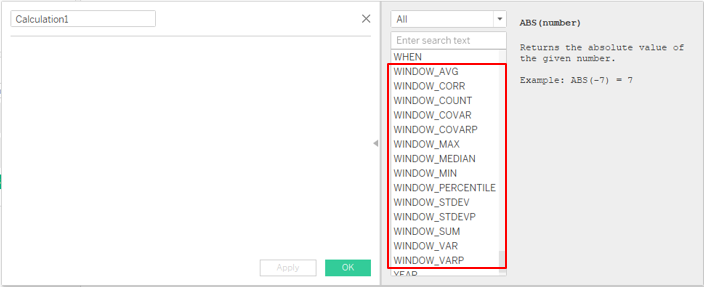
9. Click on the arrow in the calculated field pane, it takes us to all the available functions in Tableau. Scroll down to discover all the available Windows functions. The following image highlights the windows functions available in Tableau. Click on any of the Windows functions to know more about it.
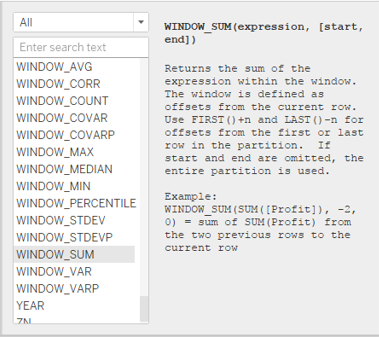
10. Selecting a particular function gives its information in detail. As can be seen in the below image, when we select the WINDOW_SUM function, Tableau gives us complete detail about the function.
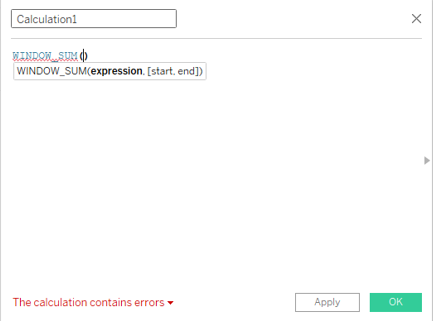
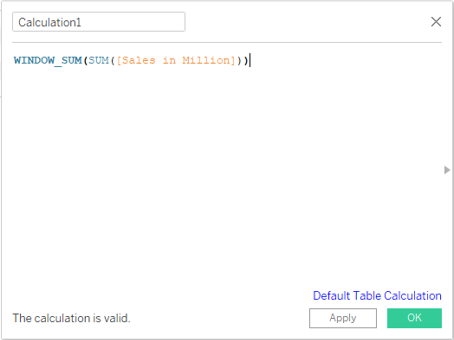
11. We shall employ this function and understand its use. Double click on it and it is brought into the calculated field pane as can be seen in the following image. As we can see, this function essentially takes three arguments viz. expression, start and end. “expression” refers to any mathematical expression that we want to pass. The start and end parameters are what basically makes the windows function differently than normal functions. They allow us to select the requisite portion of data in a column. We shall understand the use of these parameters in detail in the coming part. Observe the following image carefully.
12. For the expression argument, we passed the SUM(Sales in Million) function. The Window functions take aggregate functions as arguments and work on them.
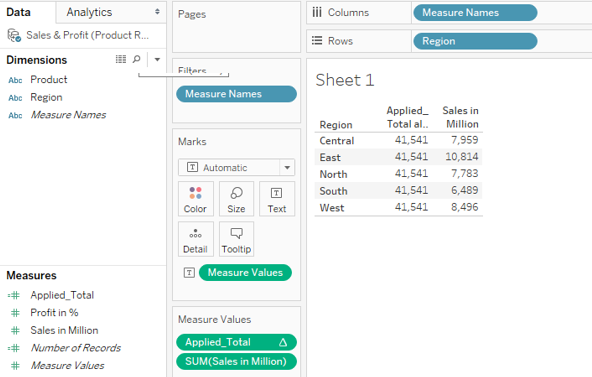
13. Let’s name the above-calculated field as “Applied_Total”, and click on Apply and then on OK. We can find the newly created calculated field in the measures section as highlighted in green. We shall bring it into analysis.
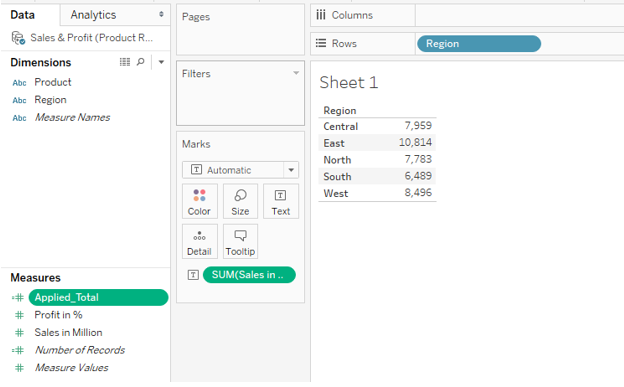
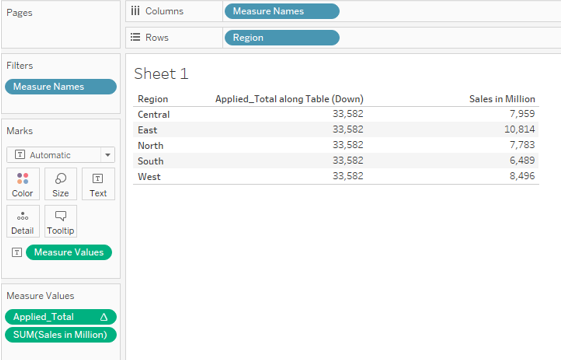
14. We brought it into the analysis as can be seen in the following image. What we can see is that we got total sales for all the regions, because we had embedded SUM function in WINDOW_SUM function.
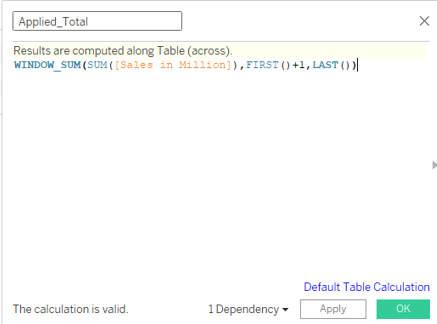
15. Now, we want total sales except that of the Central region. We can exclude the sales of the Central region using the WINDOW_SUM function. Closely observe the implementation as shown below. Now, we passed the start and end parameters. Here FIRST() and LAST() functions have been used. They do nothing but give the first and last position in the column. FIRST() + 1 means that sum operations will start from the second row i.e. from the row containing data for East region. LAST() means the calculation will happen till the end. So, we get total sales excluding that of the Central region.
16. Once done, click on Apply and then on Ok. Bring the updated Applied_Total calculated field into the analysis, and we get the figures as shown below.
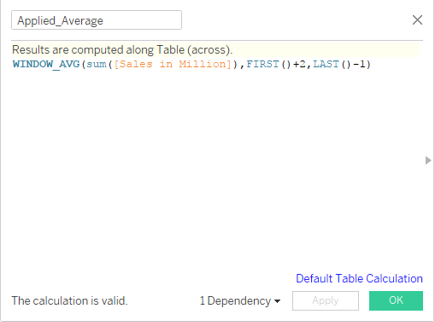
17. Now, we are interested in comparing the sales for the five regions with the average of the sales of the regions of North and South. Here, we shall be using the WINDOW_AVG function provided by Tableau. The implementation of the function is as shown in the following screenshot. Observer the start and the end parameters. We have moved two places down from above and one place up from below to get the sales average for the North and South regions only. Once done, apply the calculation and save the calculated field.
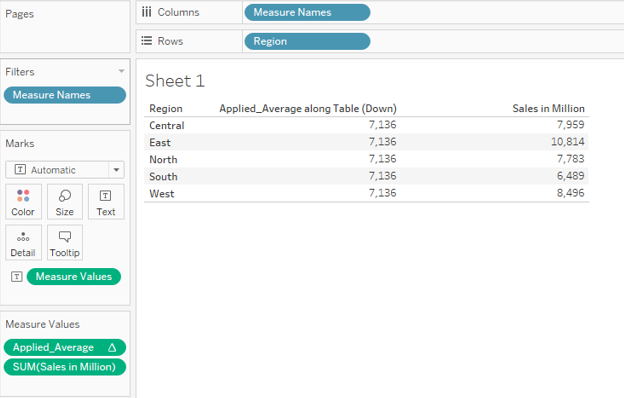
18. Once the field is updated as described above, bring it into the analysis, and we get the required average figure. The following image shows this. Now, we can compare the sales of each region with that of the average sales of North and South.
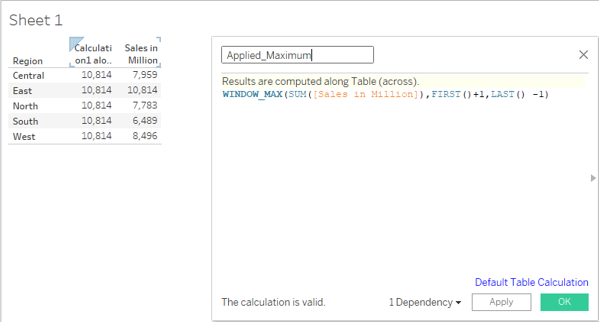
19. The following image shows the application of WINDOW_MAX function using the same process that we discussed in the preceding section. Here, we got the maximum sales from amongst East, North and South regions.
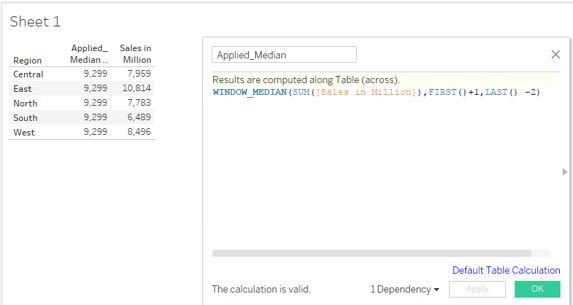
20. Just observe the following image closely. We implemented the WINDOW_MEDIAN function. The median function gives us the middle value. Observe the start and the end parameters. We chose to have a median for the East and North regions. We should cross verify the results with manual calculations to validate that the function has worked correctly. The way these Windows functions have been implemented, in a similar way all other Windows functions can be implemented. However, it is always good to have knowledge of the concept before the implementation.
Conclusion
Window functions are just variants of the normal forms of these functions. Tableau by providing us Window functions makes things easier for us especially in situations that involve working with a select portion of data. These functions must be worked with various examples to understand them properly.
Recommended Articles
This is a guide to Tableau Window Functions. Here we discuss the introduction and how does window functions work in tableau with its detailed explanation. You may also look at the following articles to learn more –
