Updated March 27, 2023

Introduction to Statistics for Machine Learning
Statistics, a subfield of mathematics can be defined as the practice or science of collecting and analyzing numerical data in large quantities. On the other hand, Machine Learning is a subset of Artificial Intelligence that uses algorithms to perform a specific task without using explicit instructions. The use of Statistical methods provides a proper direction in terms of utilizing, analyzing and presenting the raw data available for Machine Learning. ML is leveraged by a statistical approach. This has led to successful implementation in fields such as speech analysis and computer vision. The statistical analysis serves the purpose of obtaining a perspective on the data by how the sample is represented.
So, the one does not need to be a renowned statistician to implement the statistical methods used in Machine Learning, it can gradually be mastered by the means of programming and various other tools developed.
Types of Statistics for Machine Learning
Below are the points that explains the types of statistics:
1. Population
It refers to the collection that includes all the data from a defined group being studied. The size of the population may be either finite or infinite.
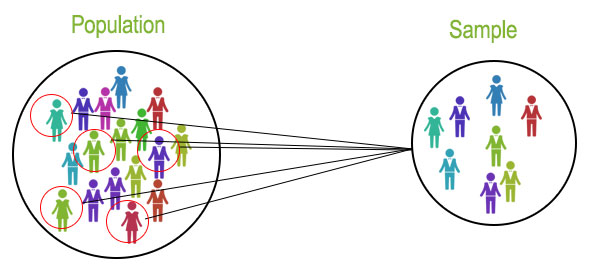
2. Sample
The study of the entire population is always not feasible, instead, a portion of data is selected from a given population to apply the statistical methods. This portion is called a Sample. The size of the sample is always finite
3. Mean
More often termed as “average”, the meaning is the number obtained by computing the sum of all observed values divided by the total number of values present in the data
4. Median
Median is the middle value when the given data are ordered from smallest to largest. In case of even observations, the median is an average value of 2 middle numbers
5. Mode
The mode is the most frequent number present in the given data. There can be more than one mode or none depending on the occurrence of numbers.
6. Variance
Variance is the averaged squared difference from the Mean. The difference is squared to not cancel out the positive and negative values.
7. Standard Deviation
Standard Deviation measures how spread out the numerical values are. It is the square root of variance. A higher number of Standard Deviation indicates that data is more spread.
8. Range
Difference between the highest and lowest observations within the given data points. With extreme high and low values, the range can be misleading, in such cases interquartile range or std is used
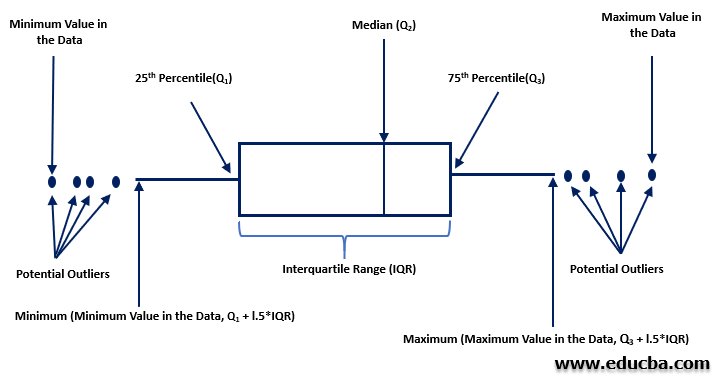
9. Inter Quartile Range (IQR)
Quartiles are the numbers that divide the given data points into quarters and are defined as below
- Q1: middle value in the first half of the ordered data points
- Q2: median of the data points
- Q3: middle value in the second half of the ordered data points
- IQR: given by Q3-Q1
IQR gives us an idea where most of the data points lie contrary to the range that only provides the difference between the extreme points. Due to this IQR can also be used to detect outliers in the given data set
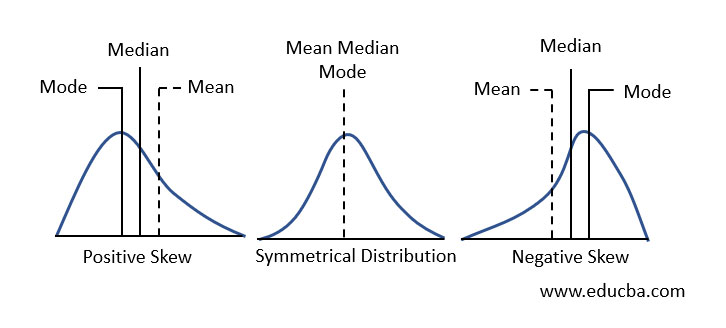
10. Skewness
Skewness gives us a measure of distortion from symmetry (skew). Depending on whether the left or right tail is skewed for given data distribution, skewness is classified into Positive and Negative skewness as illustrated below
11. Inferential Statistics
It involves mathematical estimates that allow us to infer on a pattern or trend based on the sample data sets of a larger population. Helps to generalize, conclude and predict a bigger population
12. Descriptive Statistics
It helps in understanding the basic features of the data by summarizing them in a numerical or graphical way. Facts regarding the data involved can be presented by descriptive analysis, however, any kind of generalization or conclusion is not possible.
Normal Distribution
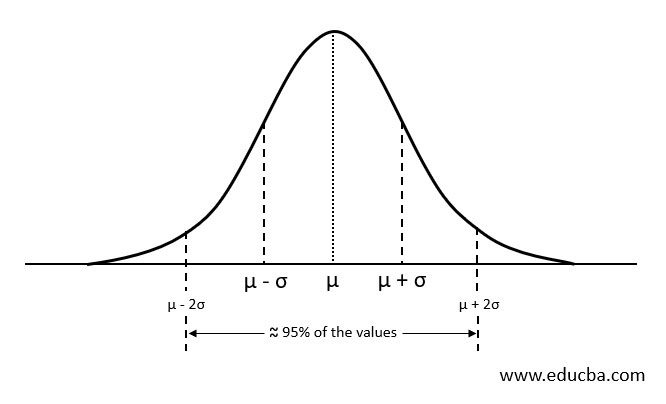
Normal or Gaussian distribution is often described as “bell-shaped-curve” because of its symmetric curve that resembles a bell. The y-axis represents the relative probability of observation from least likely to most likely. The left and right end of the curve represents the probability of an observation occurring least likely or uncommon scenario whereas the mid-section of the curve represents the most likely occurring events within a given population.
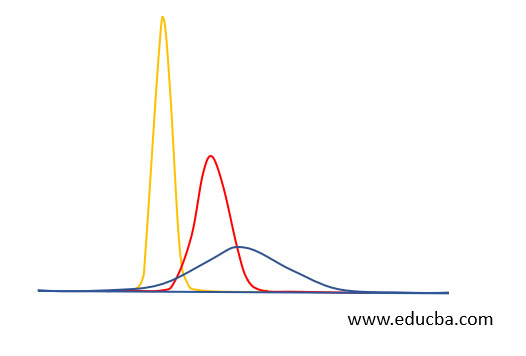
Normal Distribution is always centered around the average value. The width of the curve is determined the standard deviation, i.e. the spread of the data. Wide width accounts to a smaller height of the curve and narrow width accounts to the taller height of the curve Knowing this is helpful because normal curves are drawn such that close to 95% of the observations are between +/- 2 standard deviations around the mean.
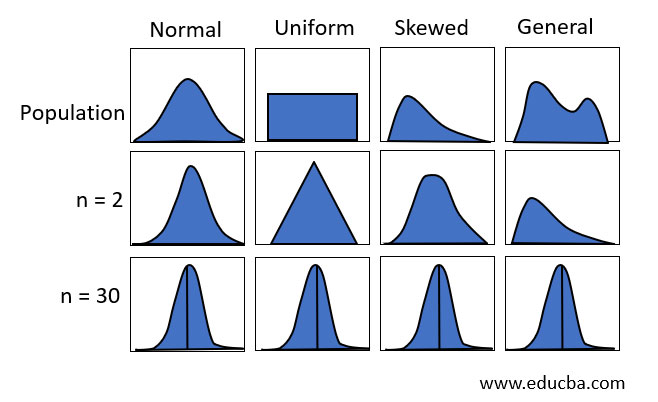
Central Limit Theorem (CLT)
Central Limit Theorem is the basis for most things in statistics.
- The central limit theorem states that if sufficiently large random samples are taken from the population, then the distribution of the sample means will be approximately normally distributed.
- This is essential because often we will be unaware of the population distribution, and by taking sufficient samples, a normal curve can be created to carry out the required statistic tests such as T-test, ANOVA and so on. As a rule of thumb, the sample size for CLT is preferred greater than 30
Hypothesis Testing
Hypothesis Testing is a statistical method used to draw inferences about the overall population. It is basically the assumption we make about the population parameter.
Assumptions made are:
- Null Hypothesis(H0): It is the hypothesis to be tested. It suggests a notion that there is no relationship or association between the 2 parameters being studied e.g. Music influences mental health
- Alternate Hypothesis (HA): All the other ideas contrasting the null hypothesis form the Alternate Hypothesis e.g. Music do not influence mental health
Errors Associated with the Hypothesis Testing
- Type 1 Error: Denoted by alpha, this error occurs when we reject the null hypothesis even though it’s true
- Type 2 Error: Denoted by beta, this error occurs when we accept the null hypothesis when it’s actually false
What is P-value?
- P-value in any statistical model indicates the probability when the null hypothesis is true. It can be considered an indicator of the level of significance of target predictors. It helps to approve or reject the null hypothesis. Generally, the level of significance is chosen to be 0.05 or 5%
- It means that if for a statistical test the p-value is less than 0.05 then we reject the null hypothesis and if the p-value is greater than 0.05 we accept the null hypothesis
Conclusion
Statistics play a crucial part in Machine Learning. The vital stages comprising of data understanding, data exploration and data selection done at the initial stages requires statistical methods and tests, Statistics speak facts and outputs significant numbers, however, the scope of ML prediction leaps beyond the inferences that the statistical methods provide. That being said, it is also important that every ML engineer possesses a good grasp on the fundamentals of statistics to apply the correct test when needed.
Recommended Articles
This is a guide to Statistics for Machine Learning. Here we discuss the types of statistics and understanding Normal Distribution, (CLT) with Hypothesis Testing and P-value. You can also go through our other related articles to learn more –
