Updated March 30, 2023

Definition of SSRS Reports
On-premises tools and services for creating, deploying, and managing portable and paginated reports are presented by SQL Server Reporting Services (SSRS). The SSRS system allows us to give the exact information to the correct users at the right time. The results can be seen in a computer browser, on a mobile device, or via email.
What are SSRS reports?
SQL Server Reporting Services (SSRS) is a Microsoft reporting tool that allows users to create prepared presentations like graphs, columns of data, and charting. These analyses are stored on the server and can be run anywhere at times using user-defined parameters. The latest evidence from the database, XML file, or even another source of data shows when we execute the report. It has security mechanisms that limit who has access to which reports. 1) Integration 2) Analytics 3) Reporting are the three forms of analytical SSRS services. SSRS allows for quick report generation for both relational and multidimensional data. Data can be retrieved using SSRSS from controlled, OLE, ODBC, and DB connections.
A SQL Server instance must be linked to an SSRS implementation. By nature, the example will have two databases:
- ReportServer – stores report definitions, configuration, history, and security information for distributed reports, among other things.
- Tempdb – similar to tempdb, it’s utilised as a workspace for creating reports and doesn’t keep any things around indefinitely.
Create SSRS reports
SSRS (SQL Server Reporting Services) is a SQL Server reporting and visualisation tool. Create, manage, and publish reports and dashboards with SSRS.
Analyse that the Data Source will show us the data that we need. There are connections to the many functional area repositories that make up the Consolidated Data Repository among the data sources supplied there.
We’ll need to construct a data set if we don’t already have one for this report. Microsoft Report Builder allows you to generate data sets. Simply select Data Set from File > New. The SQL query or stored procedure name that will be used to provide data for your report should be entered in the data set. Anyone can generate a new report whenever the dataset is ready. Select Report from File > New in Microsoft Report Builder.
How SSRS reports work?
Simple reporting deploys by email, file sharing, or SharePoint are also possible with SSRS’ built-in scheduling mechanism. SSRS can be used to deploy business reports in a range of methods and also in conjunction with other platforms. SQL reporting services can be used concerning business activity management software like PBRS to automate SSRS reports, migrate data between databases, and even trigger tasks depending on events.
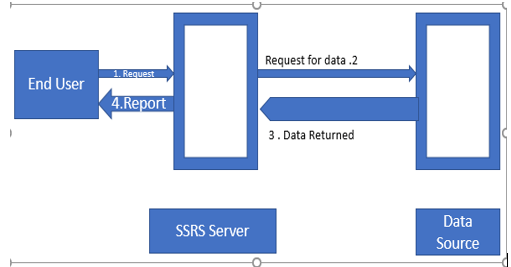
1. Report users are those who deal with data and seek to gain knowledge from it. They send an SSRS server request.
2. The SSRS server locates the review’s metadata and issues request packets to the data sources.
3. The data source’s result is added with the report criteria to create a report.
4. The application user receives the final generated report once it has been produced.
Any data source, such as Oracle, MySQL, SQL Server, and so on, can be used. Any of these data sources can be added to Microsoft SQL Server. The data extraction and presentation operations start after the data sources are connected to the SQL Server. The practice of screening and evaluating data to fulfil the demands is known as rendering. Processing of reports: Rendering is followed by report processing. The process of generating, reviewing, and amending existing reports is known as report processing. Web service interfaces in XML: When we post a report, it is automatically published to the website via the XML web service interface. SQL Server includes security, management, and execution.
Types SSRS reports
Sorts of SSRS reports:
Parameterized reports: These reports are full reports or data analysis by using input data.
Linked Reports: A linked report connects to some other report. This analysis is derived from such an existing report and retains the report description of the originator.
Snapshot reports: A snapshot report is a report that comprises layout information and query results that may be retrieved at any time.
Cached Reports: One can use the cashed report to duplicate the processed reports. They improve performance by lowering the number of processing queries and the time it takes to obtain huge reports.
Sub reports: A subreport is a report that presents a different report within the main study’s content. It’s being used to put a report inside another report. Various data providers can be used in the sub-report than those in the main report.
Drill Through: In SSRS, a drill-through report is one that a user accesses by clicking on a link within another report. Drill-through reports frequently include information about an item that was previously available in a fact sheet.
Drill Down: The way the data is processed determines how drill-down reports are generated. To highlight the connection between the top level and sub levels, we can use data from a wide variety of ways. We can show the data in a data region (tables or charts) that is nested inside of that data region (tables or matrix).
SSRS reports Examples
How to Make a Chart
Step 1: In SQL Server, build a new table called voter member with three fields: vid, v name, and gender. Now we must construct a new data source in the same manner as we did with the other Now, we must construct a new data source in the same manner as we did with the other reports.
Step 2: Create a new dataset here.
Step 3: In Reports, create a new item.
Step 4: Select the Insert option from the Report workspace’s to right-click menu, then click on the Charts.
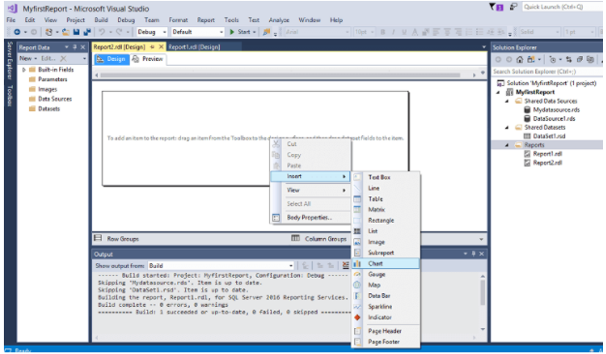
The Screen is displayed like below when we select a pie chart from the chart list.
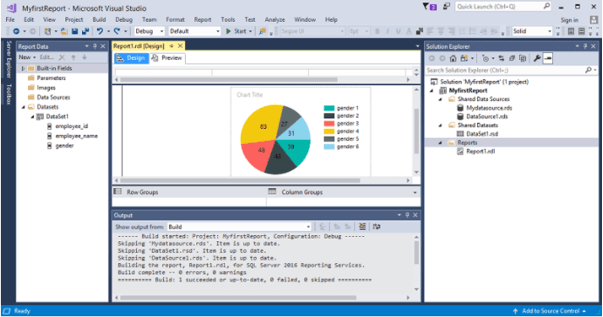
Next, add the gender type and values in the data. And finally, show the options with the data label.
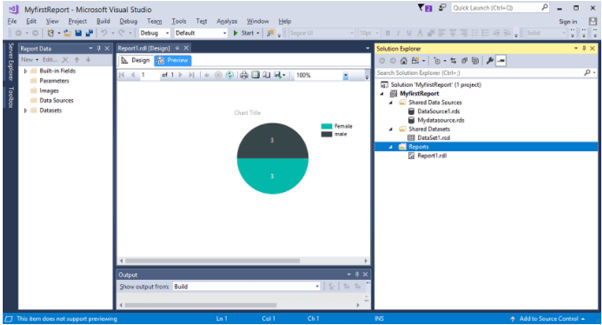
The preview part finally shows here the male and female categories in the chart.
Conclusion
As described in the SSRS tutorial with examples, the SSRS allows the creation of structured reports with tables containing graphs, data, charts, and images. And also we have seen report examples with the charts.
Recommended Articles
This is a guide to SSRS Reports. Here we discuss the definition, What are SSRS reports, Create SSRS reports, Types SSRS reports, Examples with code implementation. You may also have a look at the following articles to learn more –
