Updated March 14, 2023
Introduction to Spectrogram in Matlab
MATLAB is a programming environment that is interactive and is used in scientific computing. It is extensively used in a lot of technical fields where problem-solving, data analysis, algorithm development, and experimentation is required. The discipline-specific software is extensively written using MATLAB. In this article, we will study the Spectrogram function in MATLAB. Before we see how Spectrogram function is used in MATLAB, let us quickly refresh our understanding of Spectrogram.
A Spectrogram provides an exhaustive picture of signal strength. It is a single graph view of frequency, time & amplitude. A Spectrogram is used to visually show electrical, broadband, or intermittent noises in the signal. This further helps us in isolating the noise or other problems with the signal. Spectrogram finds great utility in post-production because of the level of detail it provides. Spectrograms are also used for displaying frequencies of audio waves that are produced by machines, animals, jets, etc. Let us now learn how Spectrogram function works in Matlab.
Syntax:
Below is the syntax for Spectrogram Matlab:
s = spectrogram (z)
Explanation: s = spectrogram (z) will return the short-term Ft (Fourier transform) of the signal ‘z’ passed as an argument. In the output, every column will contain the estimate of time localized and short-term frequency content for the input signal ‘z’. Also, by default, ‘z’ will be divided into 8 segments. If it cannot be done, then ‘z’ is truncated.
Examples to Implement Spectrogram Matlab
Let us now understand the Spectrogram function with the help of a few examples.
Example #1
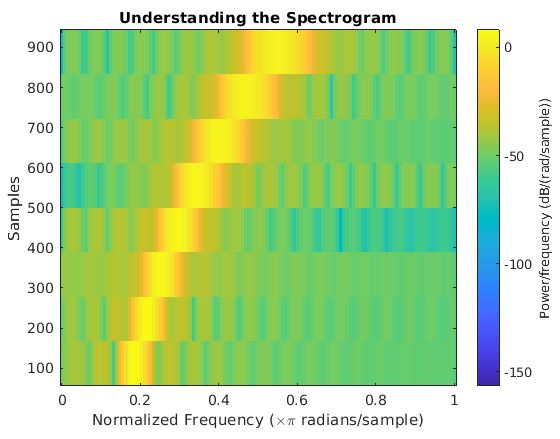
In the first example, we will create the spectrogram for the quadratic chirp:
Code:
time = 0: 0.002: 2;

z = chirp (time, 200,1, 400);

spectrogram (z);

title ('Understanding the Spectrogram')
Output:
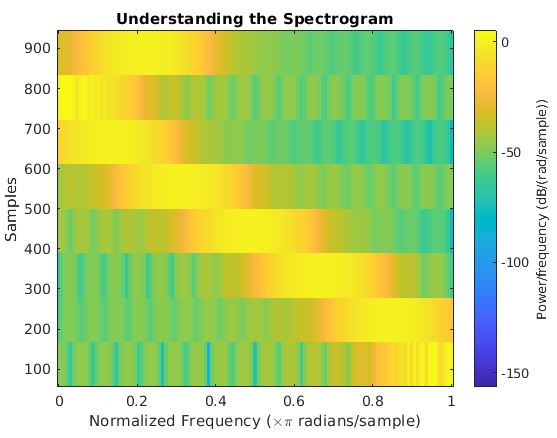
Explanation: First, create the input quadratic chirp using the chirp function. This input chirp will start at a frequency of 200 Hz and will cross 400 Hz at time = 1 second. Calling the spectrogram function. Giving the title to the output.
Example #2
Let us now take a linear chirp instead of a quadratic chirp and see how the code looks like:
Code:
time = 0: 0.002: 2;

z = chirp (time, 0, 1, 250);

spectrogram (z);

title ('Understanding the Spectrogram');
Output:
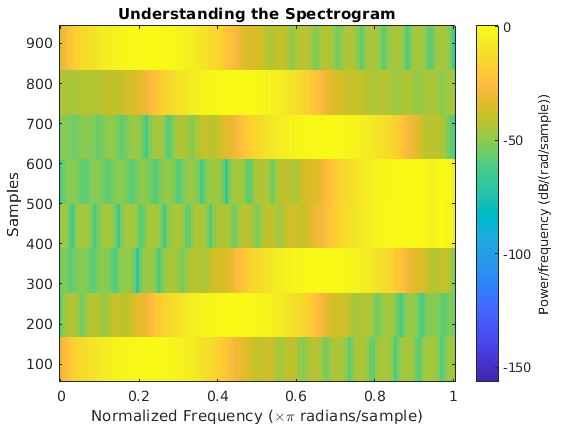
Explanation: First, create the input linear chirp using the chirp function. This input chirp will start at a frequency of 0 Hz and will cross 250 Hz at time = 1 second. Calling the spectrogram function. Giving the title to the output.
Example #3
In the next example, we will create 2056 samples of a cosine wave signal and see how the code for Spectrogram looks like:
Code:
samples = 2056;

n = 0: samples-1;

NF = 4 * pi/7;

z = cos (NF * n) + 5 * cos (3 * NF * n);

spectrogram (z);

title ('Understanding the Spectrogram');
Output:
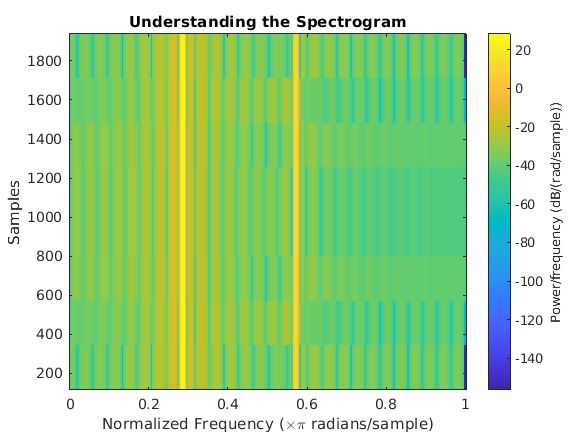
Explanation: First, Define the number of samples required. Defining the normalized frequency. Creating the input signal containing the sum of 2 cosine waves. Calling the spectrogram function. Giving the title to the output.
Example #4
In this example, we will see how the code for creating a logarithmic chirp using spectrogram looks like in MATLAB:
Code:
time = 0: 0.002: 2;

z = chirp (time, 40, 1, 80, 'logarithmic');

spectrogram (z)

title ('Understanding the Spectrogram')
Output:
Explanation: First, create the input logarithmic chirp using the chirp function. This input chirp will start at a frequency of 40 Hz and will cross 80 Hz at time = 1 second. Calling the spectrogram function. Giving the title to the output.
Conclusion
As we saw in the examples above, Spectrograms are 2-dimensional graphs, with a 3rd dimension which is represented by colors. In this article, we learned how to create the spectrograms in MATLAB using the spectrogram function. Spectrograms are very commonly used in seismic studies, where these are used to view the frequency content related to continuous signals which are recorded by multiple or individual seismometers. This helps in distinguishing and characterizing various types of earth vibrations or earthquakes.
Recommended Articles
This is a guide to Spectrogram Matlab. Here we discuss an introduction to Spectrogram Matlab, syntax, examples with code and output. You can also go through our other related articles to learn more –
