Updated July 21, 2023
Introduction to S&P 500 PE Ratio
It can be defined to be a stock market index which indicates the price-earnings ratio of the stocks of the companies recognized as S&P 500 companies of United Nations, being the companies which have been accorded the status of the top 500 companies or the largest 500 companies, based on their performance in the economy and the market, the stocks of which are listed on the recognized stock exchanges of the United Nations (UN).
S&P 500 is the stock market index that indicates the performance of stocks of the top 500 companies listed on the stock exchanges of the United States. Thus, this means the ratio of price over earnings of stocks of the top 500 companies which are listed on the stock exchanges of the UN.
How to Calculate the Ratio?
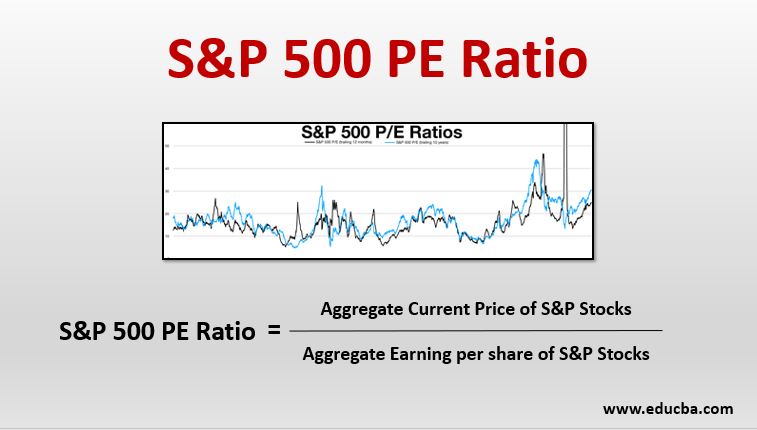
In order to calculate PE Ratio for a company, one needs to divide the current price of the stock by the earning per share of the previous year. Similarly, in order to calculate the Ratio, one needs to add the current prices of the stocks of the top 500 companies (known as S&P 500 companies), and simultaneously add the earning per share of the previous year of all the identified S&P 500 companies. PE ratio will be derived by dividing the aggregate current prices of the stocks of S&P 500 companies by the aggregate earning per share of the stocks of said companies.
Thus,
Examples
Let us take a hypothetical example in order to understand the calculation for the same.
A stock analyst identified S&P 500 companies and noted down their current market price for a particular period of time. The sum of the current market price of all the companies came down to $20,000,000. Further, he gathered data about the earning price per share of all the companies in the last year. The resultant cumulative of the earning per share came out to be $1,000,000.
Solution:
S&P 500 PE Ratio is calculated using the given formula below
S&P 500 PE Ratio = Aggregate Current Price of S&P Stocks / Aggregate Earning per Share of S&P Stocks
- S&P 500 PE Ratio = 20,000,000 / 1,000,000
- S&P 500 PE Ratio = 20
Thus, the Ratio comes out to be 20 in this example.
Current S&P 500 PE Ratio
The data with respect to the Ratio as on Thursday, 6th February 2020 is tabulated as below:
| Type of S&P 500 PE Ratio | Data |
| Current S&P 500 PE Ratio | 25.17 |
| Median | 14.81 |
| Minimum (In Dec 1917) | 05.31 |
| Maximum (In May 2009) | 123.73 |
As mentioned above, the Ratio as of 6th February 2020 stands at 25.17. Along with that, the minimum ratio has been 05.31 and the maximum ratio has been 123.73.
Difference Between S&P 500 PE Ratio and Shiller PE Ratio
It is believed that the Shiller PE ratio is a better indicator of market valuation as compared to the ratio. It is so because the companies suffer from changing market and economic conditions. Thus, the stock prices may be increasing due to favorable conditions and may be decreasing due to unfavorable conditions. In other words, the prices do not remain at equilibrium. Shiller PE Ratio tends to eliminate the effect of the change in profit margins of the companies due to change in business cycles.
On the other hand, suffers from the limitation of stock prices being affected due to abnormal change in the profit margins of the companies due to changes in the market conditions or the business cycles that they are subjected to.
Conclusion
It provides an idea as to how the stock market is performing based on which investors can decide whether it is a proper time to enter the market or not. However, it is important to note that this ratio suffers from the limitation that the stock prices are influenced by changing business cycles. Thus, one must carefully analyze this fact before coming to any conclusion.
Recommended Articles
This is a guide to S&P 500 PE Ratio. Here we discuss the introduction with an example, how to calculate, the difference between. You can also go through our other related articles to learn more –
