Introduction to SAS Base
The SAS base is one of the fourth-generation programming languages that will affect the data access to the data transformation will analyze and report the data in the SAS platform for designing the foundational datas manipulation with a high set of information storage and retrieval of the datas which include the descriptive statistics, report writing for a powerful macro facility that can be reduced the programming time consume with high maintenance.

What is SAS Base?
SAS base is the newer generation and set of programming concepts and techniques which helps to provide the scalable and software integration, which is the environment to be described along with the SAS platform designed for data concepts, including the foundation basic set of operations that can be performed the storage and retrieval the datas.
Base SAS runs all the set of significant operations, including the operating system, to reduce the complex set of programming tasks with full maintenance cost-reducing the time consumption to enable the IT operations. It has produced and analyzed the data reports, which helps to decide the data format makers in the SAS programming experts and powerful users. To prefer the code for manipulating the datas helps to produce the adhoc set of queries and reports to interpret the results in the descriptive data analysis.
Why use SAS Base?
Base SAS mainly supports the high flexibility and extensibility for 4th Generation Programming Language and easy-to-learn syntax and coding concepts for hundred languages. It mainly supports the elements, functions, and programming language, extracting the data format and cleaning the data reports with data delivery. To integrate the datas specified across the environments based upon the open-source with cross-platform architecture followed with the Base SAS hardware agile and integrated to the computing infrastructure enabled to unify the computing efforts and get into the single view of the data.
From the small amount of data issues which efforted to the complex set of data problems which helps to read the programmers, code format helps to analyze the data reports quickly regardless of the data formats. To make the programmers who help to fast and reduce the data deliver functionality with few simple commands. Increasing the data programmer’s productivity helps perform the SAS studio with a web-based development tool interface and lets us help to access the data files. To make SAS code simpler and always accessible, libraries and existing programming tools from existing programs can be used on any device with a web browser.
Steps for Creating SAS Base
Given below are the steps for creating a sas base:
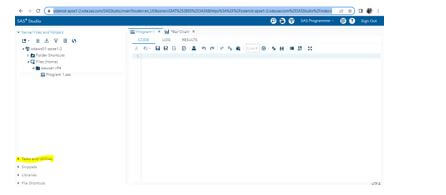
1. Navigate to the below URL after login.
2. https://odamid-apse1-2.oda.sas.com/SASStudio/main?locale=en_US&zone=GMT%252B05%253A30&https%3A%2F%2Fodamid-apse1-2.oda.sas.com%2FSASStudio%2Findex=
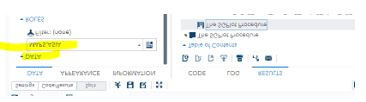
3. Choose the Option like Task and Utilities.
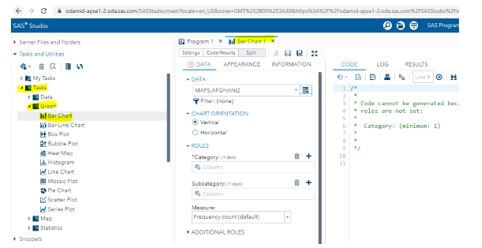
4. Choose Graph mode and select any of the charts like Bar Chart.
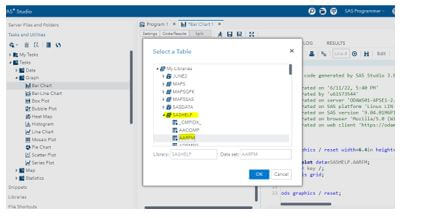
5. Choose any Data source available on the required filter like below.
6. Select Chart Orientation may be Horizontal or Vertical, and select the Roles.
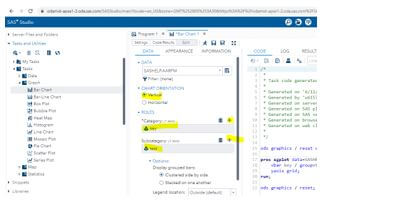
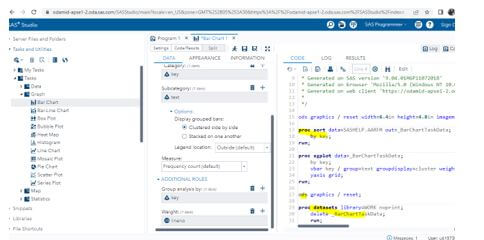
7. If we want to measure the chat with the additional set of Roles and datas along with the data source, we can select the Additional Roles or ignore them.
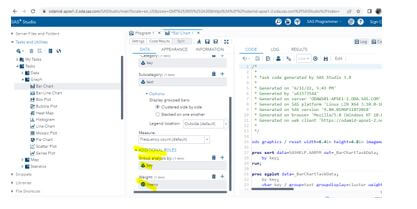
8. After setting all these configurations, the code will automatically generate like the below screenshot.
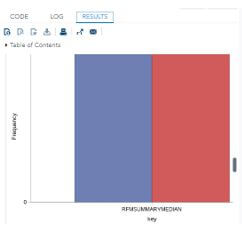
9. Then, when we execute the code, we can get the Output Result in the Bar Chart format.
SAS Base Step-by-Step Programming
- The Base SAS is highly flexible with extensible for the fourth-generation language elements and function supports for every programming Statement. Furthermore, it includes the data extraction, formatting, and cleansing of the reports, which extract the datas and format the reports with information delivery.
- Prewritten SAS procedures handle the other common tasks, including data manipulation and management for information storage, data retrieval, and report writing. It encapsulates the data delivered with significant functionalities and can be executed with a few sets of commands for the programmer to be efficient and productive.
Example of SAS Base
Given below are the examples of SAS Base:
Code:
proc means data=MAPS.ASIA noprint;
  class ID DENSITY / order=data;
  var X Y;
  output out=_BarLine_(where=(_type_ > 2)) mean(X)=resp1 sum(Y)=resp2;
  run;
  data _null_;
  retain respmin 0 respmax 0;
  retain respmin1 0 respmax1 0 respmin2 0 respmax2 0;
  set _BarLine_ end=last;
  respmin1=min(respmin1, resp1);
  respmin2=min(respmin2, resp2);
  respmax1=max(respmax1, resp1);
  respmax2=max(respmax2, resp2);
  if last then
    do;
      call symputx ("respmin1", respmin1);
      call symputx ("respmax1", respmax1);
      call symputx ("respmin2", respmin2);
      call symputx ("respmax2", respmax2);
      call symputx ("respmin", min(respmin1, respmin2));
      call symputx ("respmax", max(respmax1, respmax2));
   end;
run;
%macro offset ();
  %if %sysevalf(&respmin eq 0) %then
    %do;
       offsetmin=0 %end;
 %if %sysevalf(&respmax eq 0) %then
    %do;
       offsetmax=0 %end;
%mend offset;
ods graphics / reset width=6.4in height=4.8in imagemap;
proc sgplot data=MAPS.ASIA nocycleattrs;
    vbar ID / response=X group=DENSITY groupdisplay=cluster stat=mean;
    vline ID / response=Y group=DENSITY stat=sum y2axis;
    yaxis grid min=&respmin1 max=&respmax1 %offset();
    y2axis min=&respmin2 max=&respmax2 %offset();
    keylegend / location=outside;
run;
ods graphics / reset;
proc datasets library=WORK noprint;
   delete _BarLine_;
   run;
Output:
- The above example created the SAS base program with some data sets and information.
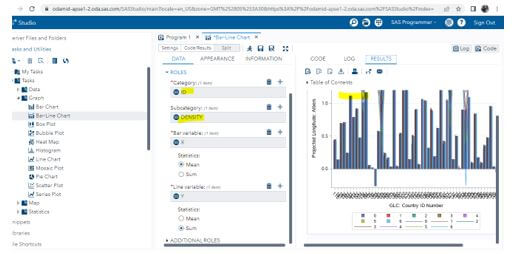
- Next, we have used the default data set, which is already pre-defined in the Graph called the Bar-line chart.
- Then we need to assign the roles with the specified category or sub-category; if the chart is in the Bar chart, we can declare the Bar and Line variables.
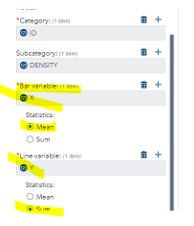
- We must ensure the bar is in Mean Statistics or Sum; the same will apply to the Line variable. Then, if we need to assign Additional Roles, we can assign them appropriately.
- To proceed with the datasets, which include the Maps. Asia data endpoint with a bar line chart to check the if and do loop to validate the conditions.
Conclusion
The data access for the fourth-generation computer programming language is the SAS base, which is used to transform the datas, analyze, and get the report results. Mainly it includes the SAS platform, which is designed for foundational data manipulation, information storage, and retrieval using descriptive statistics for report generation.
Recommended Articles
This is a guide to SAS Base. Here we discuss the introduction, steps for creating a SAS base, and examples for better understanding. You may also have a look at the following articles to learn more –
