Updated March 15, 2023
Introduction to SAS Visual Analytics
SAS visual analytics is one of the tools which helps to provide the modern, integrated environment for both governed discovery and exploration for all the users which include the skills like advanced analytical skills with or without and it can be examined for the users to triage the issue and understand the design patterns for data relationships is assigned to create and share the data reports.
What is SAS visual analytics?
SAS Visual Analytics mainly provided the modern, integrated environment for governed discovery and other explorations which is maintained by the users. It includes all those relationships without advanced analytical skills that can be examined and understand the design patterns with data relationships and other trends. It’s mainly easy to create and share the data reports for all the dashboards that can monitor the user and business performance. Mainly easy to use the data analytics and visualizations with everyone on the get insights from the user datas to transfer the data better to solve complex business problems. It is used in the user’s sight and skill levels to visualize the user explore datas and use the automated data analysis which created the data visualizations while data tapping into the powerful memory technologies.
How to use SAS visual analytics?
The Analytical capabilities are more tailored and it is easier for using to quickly access the possible outcomes for estimating the unknown parameters in support of better business analytics. Business users get the user responses from their needs and they specialized with constant requests for deep analyses and it specialists with the constant requests for all the analyses. It enables the business analysts to quickly assess possible outcomes on the estimate unknown parameters to the support decisions with possible outcome capabilities may be included.
- Automated Forecasting:
It’s the most and main appropriate forecasting method in the suitable datas even though we noticed the users are almost the novice with forecast reliability. Users can use the SAS visual data builders for preparing data for more exploration and data mining in a very easy manner. They can be summarized the join forceful datas with increased predictive powers of their datas by using the data builders.
- Scenario Analysis:
To identify the most important variables and mainly to configure how to perform the user changes and it is influenced the forecasts. It mainly performed the automated analyses and drillable hierarchies in the self-serviced manners without need in the pre-defined user-defined paths with some harmful scenarios another activity.
- Goal seeking:
Determine the user goals for achieving the underlying factors that would require more features and other skills that depend on the project requirements and implementation team to achieve the target forecasts in the user dependencies. To add the visualizations cells for charts like bars and heat maps for to achieve the user tables to perform the user operations and user.
- Network diagrams:
It shows only the complex data for how to interconnect the datas with table cells to visualize the bar charts. It reuses and shares the data modifications with include the network diagrams and correlation matrices on the pie and line charts. With forecasting and coordinating with the parallel plots, donut charts with decision trees, and other views.
- Path Analysis:
It visualizes the data relationships between the unique sequence of data events and path analysis between the display data flow from one event to another data events as a series of paths.
- Text Analysis:
It applies the data sentiment from the analysis of the social account with related datas on youtube, Twitter, Facebook and google analytics data on the customer comments. It provides fast insight into what’s being discussed on social media beyond datas. SAS visual analytics will provide the more displayed datas with a simple type of words on the data contents with categorization for text analysis and safe the data words. SAS visual analytics is more reduced and use the data analytics tools to perform the user systems and it must contain the business users in the parallel datas for loading into the sufficient memory locations for the environment provided for the database relationship like many relationship and other Hadoop data sources. It may be called the data compression for available data sources in each type of load which are available under the large set of data memories available in the business users. SAS visual analytics on the SAS distributed mode with massive computer clusters on the distributed nodes and computing power will be more consumed.
SAS visual analytics Pricing and Features
The SAS visual analytics is its own flagship for offering data preparation with visual analytics for interactive reporting datas and other dashboards. Its more well and easy to analyze the data governance for both technical and non-technical users to create, share and execute the BI and analytics for data workflows to interactive data and user reports from exploration. It has deployment flexibility for the SAS visual analytics needed to run either on the single server with the distributed model using the massive computer clusters.
Features
- It’s mainly easy to use the create data models that are more stable with data accuracy for the creation and other data-proven techniques.
- To interact with the user data preparation for data service analysis on the visualization. To unify the datasets with a diverse set of relationships presented in the easily interpret formats.
- Discover the data relationships with specified design patterns.
- Visualize the data displayed with the Intuitive Graphics.
- To Glean the data-based insights for business needs and data identifying patterns.
- Perform Guided with Augmented analysis on the automated features
- To make better decisions for business growth.
- To follow the data-driven business decisions approach for historical information.
- To collaborate on the data dashboards and share them with all internal clients and other key groups.
- Distribute the pdf share reports accurately and more securely for restriction in the integrity of the report.
Prices:
- For License and subscription costs the price is varied and served to the user capacity which includes the license and hosting infrastructure cost.
- The maintenance cost is accurate with the on-premise cost for both upfront and support paid for ongoing support and maintenance.
- Customization cost is more required for the additional functional requirement with configurable requirements and other dashboards on the data elements with required tracking.
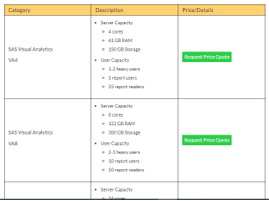
- The above two SAS Visual Analytics VA4 and SAS Visual Analytics VA8 are the two categories for the servers.
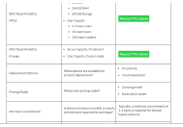
5. With additional and other deployment options for to perform and other available options. The pricing model and other minimum commitments are required for the data purchases.
Conclusion
The ability to connect with all third parties and merge with their data-related things to join together from one system to another system. To analyze the data structures and other related information with more consistent and reliable ways for the SAS Business intelligence powerful systems to run the technical codes with extendable features.
Recommended Article
This is a guide to SAS Visual Analytics. Here we discuss the Definition, What is SAS visual analytics, and How to use SAS visual analytics, respectively. You may also have a look at the following articles to learn more –
