Updated November 18, 2023
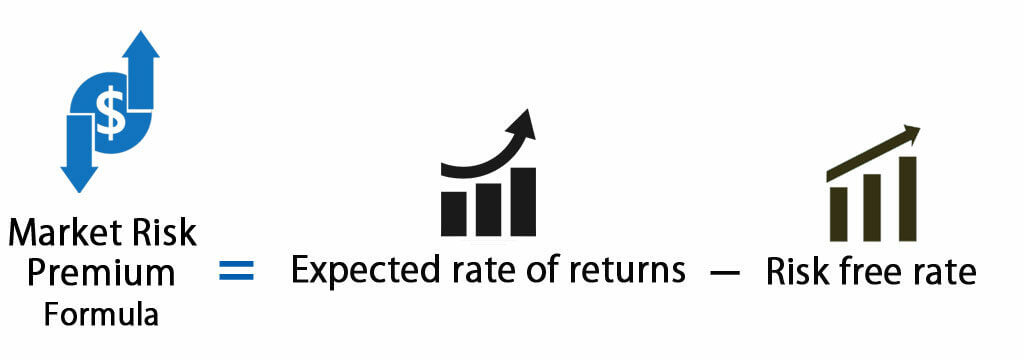
Risk Premium Formula
The return on investments is directly proportional to the underlying risk of the asset. More risk gives more returns. The risk-to-return ratio measures how much returns an investment can make, provided a given risk.
Market Risk Premium –
Everybody knows every asset class has different returns; the following chart shows it instrument-wise.
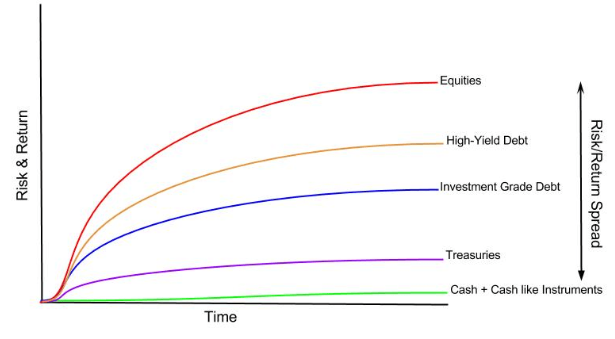
You can see cash has no returns or cash equivalents have some returns. Government treasuries offer return which is considered risk-free. As risk increases, returns increase. Equity is considered the riskiest class of investment & from the above graph, you can see this asset class also offers the highest returns. The same concept can be understood by understanding the risk premium concept.
Explanation of Risk Premium Formula
The risk premium is the additional returns an investor will gain (or expect to receive) from buying a risky market portfolio instead of risk-free assets.
The market risk premium is an integral part of the Capital Asset Pricing Model (CAPM model), which investors and analysts use to determine the acceptable return rate on investments. The CAPM model’s core is the concept of reward (rate of returns) and risk (volatility of returns). Investors always like to have the maximum possible returns on investments combined with the lowest possible risk of returns.
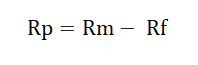
Market Risk Premium Formula is as follows –
![]()
Or
The risk-free rate is a return on investments in the Government’s bond. A government bond is considered a safe investment as the possibility of the Government getting default is very thin or almost no possibility.
Examples
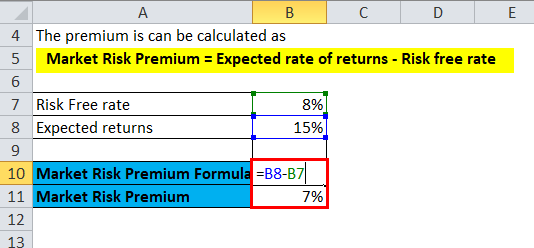
NIFTY has generated a return of 15 % the previous year, and the current rate of the Treasury bill is 8 %.
Here,
- Expected rate of return = 15 %
- Risk free rate = 8 %
The premium can be calculated as
- Market Risk Premium = Expected rate of returns – Risk-free rate
- Market risk Premium = 15 % – 8 %
- Market Risk Premium = 7 %
In the above example, the risk premium on NIFTY is calculated the same way it can be done with any specific asset class. From the above formula, one can understand for taking more risk than risk-free investment, an investor will be getting 7 % extra returns for the extra risk.
Same way, for corporate bonds, it gets applied.
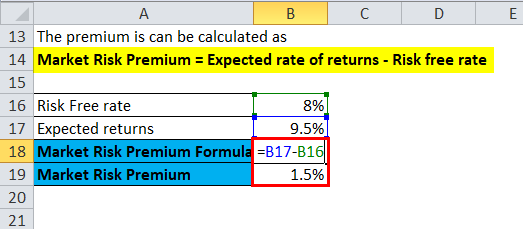
Reliance Industries’ corporate bond’s coupon rate is 9.5 %, and the Government bond rate is 8 %.
Here,
- Expected rate of return = 9.5 %
- Risk free rate = 8 %
The premium can be calculated as
- Market Risk Premium = Expected rate of returns – Risk-free rate
- Market risk Premium = 9.5% – 8 %
- Market Risk Premium = 1.5%
So, from the above example, investors in Reliance Industries will be getting a risk premium of 1.5% above the government bond rate.
Significance and Use of Risk Premium Formula
It must be understood that market risk premium helps assess probable returns on investment compared to investment where a risk of loss is zero, as in the case of Government-issued bonds and treasuries. Additional return on a riskier asset is not guaranteed or promised in the above calculation or by any related factors. It is the risk investors agree to take in return for more returns. One should note that there is a difference between anticipated and actual returns.
As stated above, the market risk premium is integral to the Capital Asset Pricing Model (CAPM). In the CAPM model, the return on an investment is the premium plus the risk-free rate multiplied by the asset’s beta. The beta is the measure of how risky an investment is compared to the market index, and as such, the premium is adjusted for the extra risk on the asset.
An asset with no risk has zero betas; for example, in the above-mentioned formula, the market risk premium will be canceled out with a risk-free asset. On the other hand, the highest risky asset, with a beta of 2, would take on double the premium. At 1.5 beta, the asset is 150% more volatile than the market and will take 1.5 times the risk premium.
It is important to understand that the relationship between reward and risk is the main reason behind market risk premiums calculations. If an asset returns 10 % every year without fail, it has zero volatility of returns or zero risks. If a different kind of asset returns 20% in year one, 30% in year two, and 15% in year three, it has a higher volatility or risk of returns. It is therefore considered “riskier”, even though it has a higher average return profile than a risk-free asset.
Risk Premium Calculator
You can use the following Risk Premium Calculator
| Expected rate of returns | |
| Risk free rate | |
| Market Risk Premium Formula | |
| Market Risk Premium Formula = | Expected rate of returns – Risk free rate |
| = | 0 – 0 |
| = | 0 |
Risk Premium Formula in Excel (With Excel Template)
Here, we will do the same example of the Risk Premium formula in Excel. It is very easy and simple. You need to provide the two inputs of an Expected rate of returns and a Risk-free rate
You can easily calculate the Risk Premium using the Formula in the template provided.
In the first example, the risk-free rate is 8%, and the expected returns are 15%.
Here, the Risk Premium is calculated using the formula.
In the second example, the risk-free rate is 8%, and the expected return is 9.5%.
Here, the Risk Premium is calculated using the formula.
Recommended Articles
This has been a guide to a Risk Premium formula. Here, we discuss its uses along with practical examples. We also provide a risk premium calculator with a downloadable Excel template. You may also look at the following articles to learn more –
