What is Ratio Analysis?
Ratio analysis is a way for businesses or investors to check if a company is doing well and making enough money to pay its debts by looking at its financial statements.
Analysts also compare the ratios with similar firms in the industry or analyze the company’s trend over a period. This comparison plays a vital role in the business planning process. Analysts also use ratios like current ratio, ROI, debt to equity, P/E, etc., to perform business analysis.
Key Takeaways
- Ratio analysis is the process of evaluating firms for their financial performance. The method of comparing these ratios across companies and time provides valuable information.
- The ratios are classified into five aspects: liquidity, profitability, turnover, earnings, and solvency. One other kind is efficiency which encapsulates ratios from the other elements.
- It can be advantageous to businesses to create future strategic plans. Creditors and investors can also benefit from the analysis, as it can help them make crucial decisions.
- This analysis comes with both limitations and benefits. The study can be efficient only when the analysts use accurate perception, data, and methods.

Purpose of Ratio Analysis
- Analyzing financial ratios helps predict the various aspects of a company’s performance.
- The goal is to comprehensively understand the firm’s liquidity, solvency, profitability, etc.
- Analysts use it to measure the position of a company in the current market.
- They can also use ratios to compare performances between firms of similar industries.
- It can help companies make crucial changes to the business to enhance their growth.
- At the same time, investors can use the understanding of the business’ health to make investing decisions.
Ratio Analysis – Classification
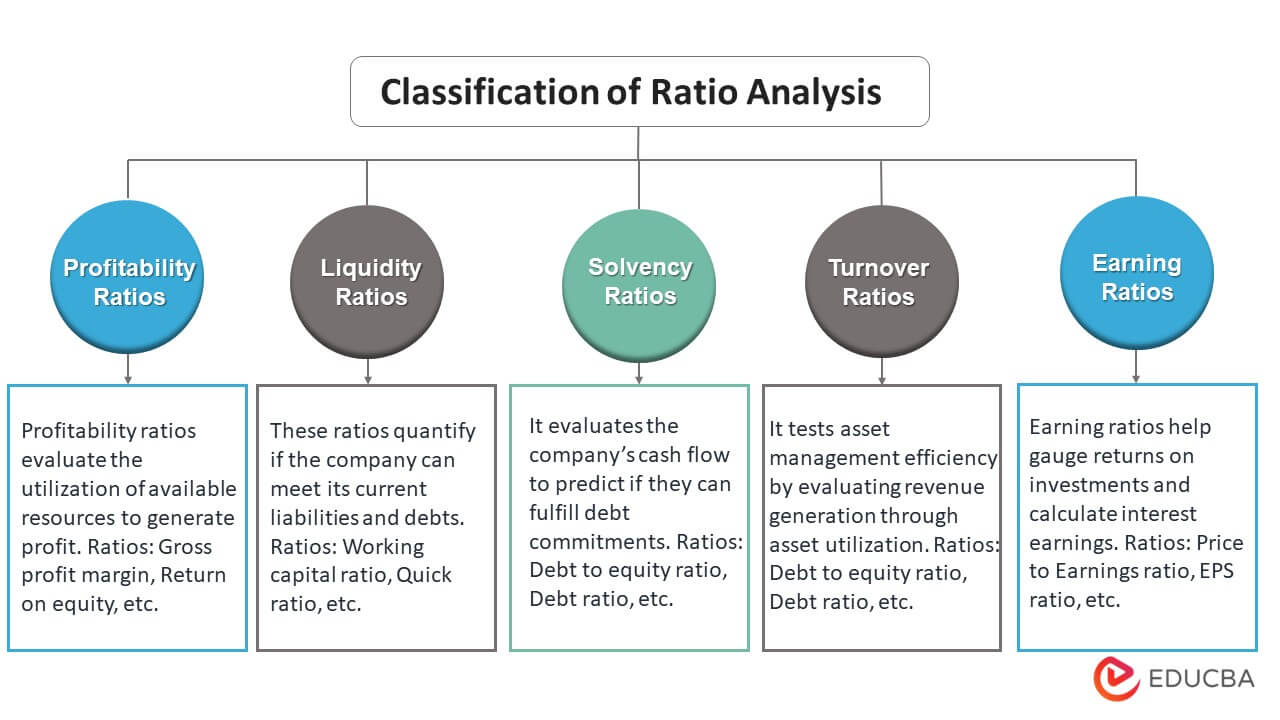
Financial ratios classification can be divided into five broad areas: liquidity, profitability, turnover, solvency, and earnings ratios. Every category of ratio analysis contains various ratios that determine the specifics of a company.
1. Liquidity Ratios
These ratios quantify if the company can meet its current liabilities and debts. It also tells if the company can pay them off while they are due. They depict if the cash and cash equivalents are enough to cover the short-term debt commitments.
The company is liquid and financially healthy when the ratio’s value exceeds one. However, if the resulting value is less than one, it shows a failure to meet obligations.
Some common ratios to determine a company’s liquidity are,
Current ratio
- It measures the short-term solvency of the company using the balance sheet.
- It tells if a firm has sufficient funds to pay its liabilities over the next 12 months. Creditors use it when deciding to lend short-term loans.
Cash ratio
- The cash ratio further refines the current ratio and quick ratio. However, it considers only the most liquid short-term assets of the company. Those are assets that companies can easily use to pay off existing commitments.
- It is also the most stringent measure among the three liquidity ratios. A favorable ratio should be equal to or above one.
Quick / Acid-test ratio
- This ratio estimates if the company can meet its current short-term obligations.
- It also assesses the available liquid assets the company can convert into cash immediately.
2. Profitability Ratios
Profitability ratios measure a firm’s operational competence. It also evaluates the utilization of available resources to generate profit. While analyzing profitability, analysts consider the nature of the business.
For instance, the profitability would differ throughout the year if it is a seasonal business. In most of these ratios, a higher percentage is better as it implies revenue generation and profit.
The profitability ratio is further divided into the margin and returns ratios. Some important ratios are,
Gross profit margin
- It is a measure that shows the gross profit after deducting production costs.
- It is a percentage disclosing a firm’s profit after considering the prices for materials, labor, etc.
Operating profit margin
- This ratio is similar to gross profit margin except that it calculates operating expenses.
- These are expenses like rent, wages, transportation, marketing, etc. This ratio does not include interest and tax amounts.
Net profit margin/ratio
- It measures the profit percentage after subtracting all expenses from the revenue. Its representation can be both in decimals and percentages.
- The favorable ratio can be industry-specific. However, a percentage greater than 10 and less than 20 is considerably good.
Return on assets (ROA)
- It indicates the profitability ratio of a firm concerning all its resources/assets. As this ratio considers all assets, it helps determine efficiency in utilizing its assets.
- A percentage above 5% is good and profitable. However, a ratio over 20% is an excellent measure.
Return on Investment (ROI)
- ROI is a performance measure that evaluates the efficiency of an investment. It compares the gains from Investment directly to the investment costs.
- It is also a universally used approach for assessing the financial magnitudes of business investments, decisions, or actions.
Return on Equity (ROE)
- This ratio discloses a firm’s profit compared to its shareholders’ equity.
- It is one of the crucial financial ratios and indicators of profitability. Analysts consider values above 20% a good measure.
3. Turnover Ratios
It indicates the firm’s efficiency concerning its asset management. It also shows the utilization of its assets to make revenue. The standard of this ratio is industry-specific and depends upon the requirement of assets.
The following turnover ratios can analyze the effectiveness of asset use.
Inventory Turnover Ratio
- This metric indicates the frequency of inventory-to-sales conversion over a period.
- It generally compares the Inventory and sales levels. Thus, it can be an effective tool for inventory management.
Inventory turnover days = 365 / Inventory turnover
Debtor Turnover Ratio
- The Debtor Turnover Ratio calculates how quickly a firm collects outstanding cash from its debtors in an accounting period. It is also known as the accounts receivable turnover ratio.
- It also determines if the firm has problems converting its credit sales into cash.
Average collection period = 365 / Debtors turnover ratio
Assets Turnover Ratio
- This ratio compares a company’s sales revenue to its assets. It depicts how efficiently and effectively the firm utilizes its assets.
- The higher the percentage, the better the utilization.
Creditor Turnover Ratio
- The creditor Turnover Ratio evaluates how often and frequently the businesses pay off their creditors/suppliers in a particular period. It is also known as the accounts payable turnover ratio.
- It can also help firms analyze how they have been handling their payments. Therefore, the higher the ratio, the better.
Purchases = Cost of sales + Ending Inventory – beginning Inventory
Days Payable Outstanding (DPO) = 365 / Creditors turnover ratio
4. Solvency Ratios
These ratios evaluate a firm’s capacity to fulfill its debt commitments. It generally assesses the company’s cash flow to predict the execution of long-term obligations. Creditors determine if they should lend funds using these ratios.
The essential solvency ratios are,
Debt to equity ratio
- This ratio indicates the relation between equity and debt funding the assets. Financial lenders consider this ratio before granting an obligation.
- If this ratio is too high, the business is expensive or too low; they cannot pay debts. The optimal ratio is one, i.e., when the liabilities are equal to equity.
Debt service coverage ratio
- It depicts the ability of the firm to pay back its principal loan and interest amount using current cash flow.
- It is also an essential ratio for lending institutions. A debt service coverage ratio below 1 indicates a negative cash flow.
Debt ratio
- This ratio signifies the amount of debt the firm relies on to finance its assets.
- The higher the percentage, the greater the risk. Thus, a below 20-30% ratio favors debt grantors.
5. Earning Ratios
Earning ratios are helpful for investors as they gauge returns on their investments. These ratios tell shareholders and investors their interest earnings. It also evaluates the fundamental business analysis to predict its future performance.
Some of the prominent ratios include,
Earnings per share (EPS)
- This ratio helps measure profits available to equity shareholders on a per-share basis.
- It also comprehends the earnings per outstanding share. Diluted EPS considers debt convertibles as well.
Price to earnings or P/E ratio
- This ratio signifies the value of a company as per its current share price and EPS.
- It indicates investors’ expectations of the stock. A P/E ratio lower than 20 is beneficial.
Dividends payout ratio
- It accounts for the relationship between the earnings belonging to the equity shareholders and their dividend payments.
- The ratio should be between 30% to 50%. Higher or lower than that percentage would be uneconomic.
Dividend per share (DPS)
- It calculates the ratio for the relation between dividend payments and the outstanding shares.
- A good ratio falls in between the range of 30-55%.
6. Other Ratios
Expenses Ratio
This ratio can help identify and understand cost behavior concerning sales. The various ratios are,
1 – Cost of goods sold = Cost of goods sold/Net sales*100
2 – Administrative Expenses Ratio = Administrative Expenses Net sales*100
3 – Selling and distribution expenses ratio = Selling and distribution expenses/Net sales*100
Ratio Analysis – Examples
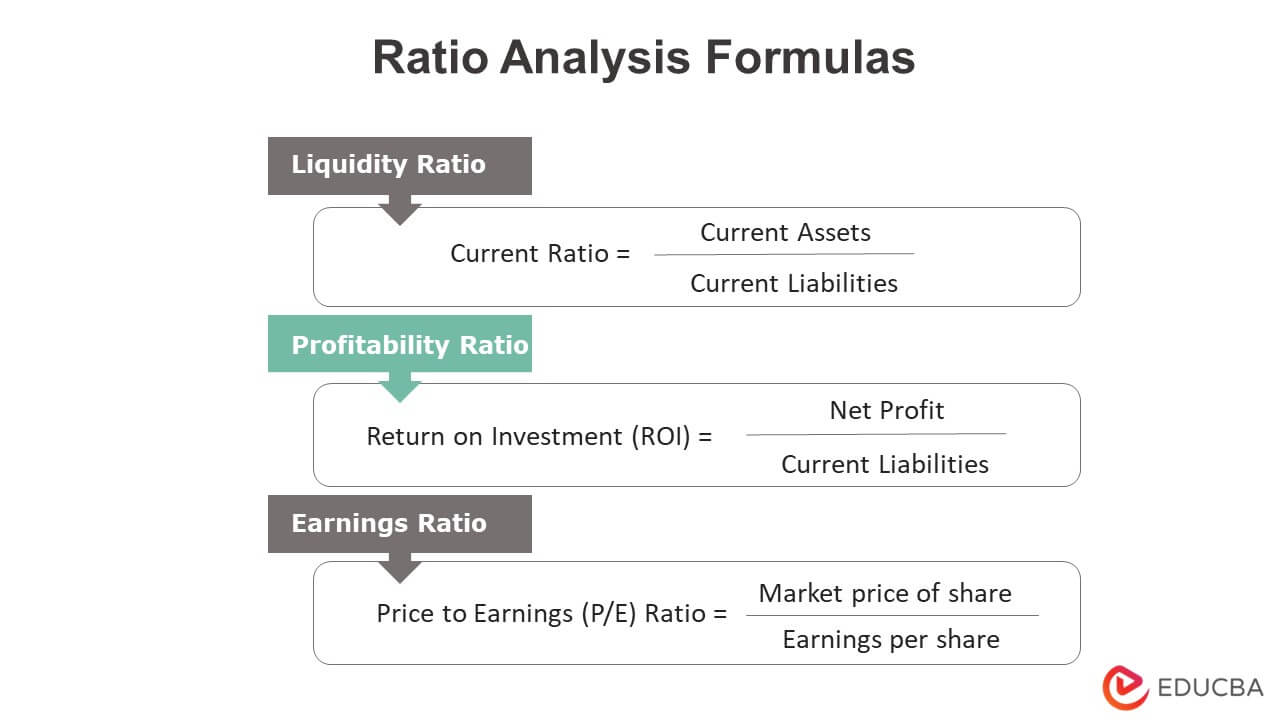
Let us view a few ratios and their analysis through examples.
Example 1
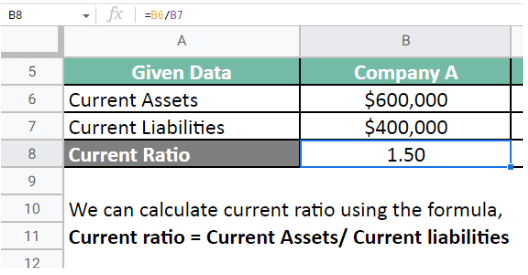
A creditor wants to decide between companies A and B to make a debt obligation. Company A has current assets summing up to $600,000 with liabilities of $400,000. Company B also has current assets of $700,000 and $1,000,000 in liabilities. Therefore, perform ratio analysis by calculating both companies’ current ratio (liquidity ratio).
Given,

Let us calculate the current ratio for Company A.
Let us calculate the current ratio for Company B.
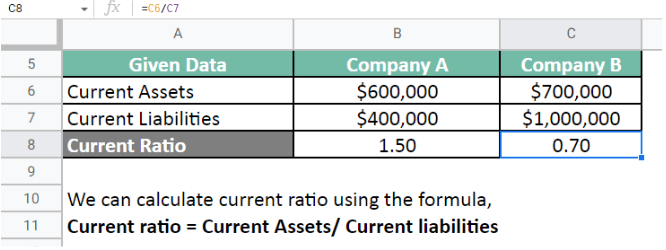
Therefore, the current ratio for both companies is,
Company A = 1.5 ; Company B = 0.7 ;
The current ratio of Company A is higher than Company B, meaning it is comparatively more liquid. Thus, Company A will be more beneficial for the creditor.
Example 2
An investor wants to calculate the return on his investments. They invested $200 per share for 50 shares in the first year and $210 for 30 shares the following year. The total return they received after selling those shares after a year was $270 per share. The company also has total assets worth $300,000. Perform ratio analysis by calculating the ROI ratio.
Given,

Let us calculate the cost of Investment and the net profit.
Cost of Investment = No. Of. Shares * Share Price

Net profit = Selling Price – Cost of Investment

Let us calculate the ROI ratio.
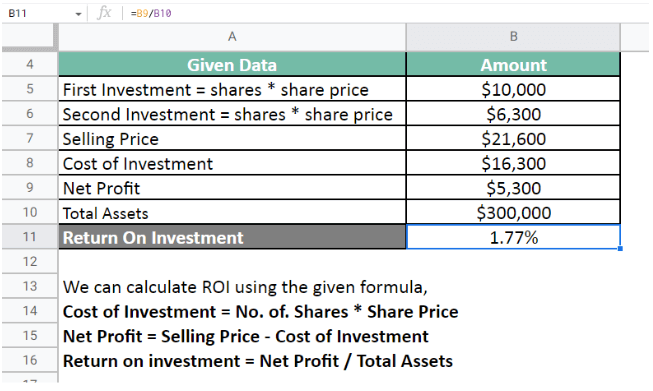
Therefore, the ROI ratio is 1.77%.
The investor earned a 1.77% return on their Investment in a year.
Example 3
An investor wants to invest in either Stock A or Stock B. The total outstanding shares for Stock A are 150,000, with a market price of $40. The total outstanding shares for Stock B are 220,000, with a market price of $35. Their annual net income is $550,000 and $490,000, respectively. Therefore, perform ratio analysis by calculating the P/E ratio.
Given,

Let us calculate the earnings per share for both stocks.
Earnings per share = Net Income / Outstanding Shares

Let us calculate the P/E ratios.
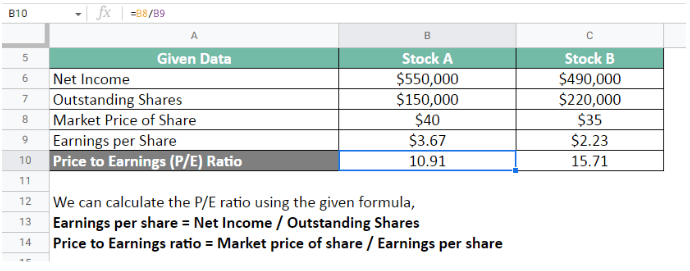
Therefore, the P/E ratios are,
Stock A = 10.91 ; Stock B = 15.71
Both companies have similar profit margins, revenue growth, corporate governance, and leverage. Thus, Stock A will be a better investment.
Limitations of Ratio Analysis
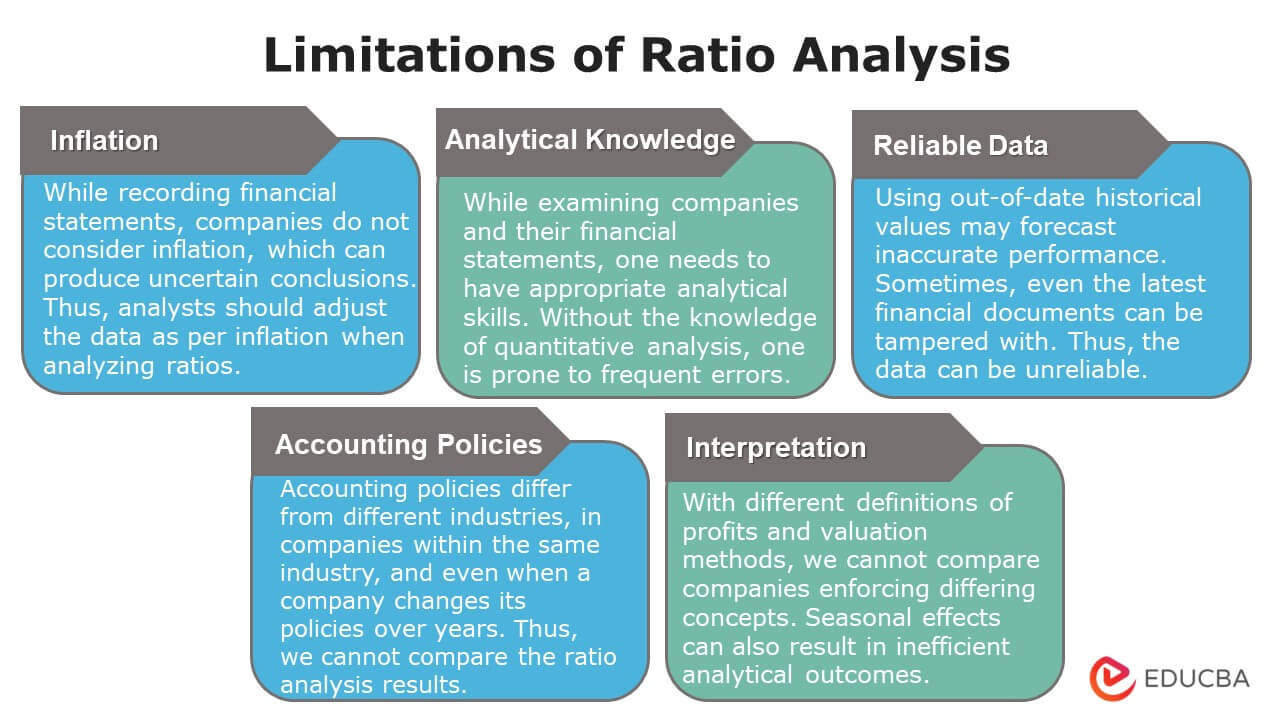
Ratio analysis is one of the most prominent tools to study a business and determine its potential. However, there are limitations to these ratios that can cause inaccuracy. Given are a few limitations of ratio analysis.
1. Inflation
While recording financial statements, companies do not consider inflation. Thus, analysts should adjust the data as per inflation when analyzing ratios. Otherwise, if they analyze ratios over different periods, it might produce uncertain conclusions.
2. Analytical Knowledge
While examining companies and their financial statements, one needs to have appropriate analytical skills. Without the knowledge of quantitative analysis, one is prone to frequent errors.
3. Reliable Data
Analysts gather data from the company’s historical or the latest financial statements. Therefore, using historical values that are out-of-date with current market trends will not forecast accurate performance. Sometimes, even the latest financial documents are also tampered with by the management. Thus, the business analysis will be incorrect if the data is unreliable.
4. Accounting Policies
The implementation of accounting policies differs from industry to industry. However, sometimes, within the same industry, various companies follow individual accounting policies. Thus, we cannot compare the ratio analysis results among industrial firms. In addition, companies cannot compare their current analysis reports to previous years’ reports if they adopt new policies.
5. Evaluation & Interpretation
There are different definitions of profits and valuation methods. We cannot compare companies enforcing differing concepts. Furthermore, every analyst has their own technique to evaluate and interpret ratios and their knowledge of the subject. Seasonal effects can also result in inefficient analytical outcomes.
Benefits of Ratio Analysis
- Efficiency: Ratio analysis provides businesses with a tool to measure their efficiency. It is also an accessible method to determine the operational efficiency of corporations. For instance, turnover ratios help enterprises assess their asset utilization.
- Planning: Firms can use these ratios to forecast their future performance and plan strategies. Planning concerning market expectations can be implemented over a period. Companies can also analyze historical data and create orderly budgets.
- Performance aspects: Investors can use companies’ performance reports before making investments. Ratio analysis determines a company’s profitability. Thus, it can help investors decide whether to invest or not. Creditors and lenders can also use the solvency and liquidity values to grant debts.
Conclusion
Ratio analysis is an instrument analysts use to calculate business performance aspects. These ratios can determine the company’s efficiency by projecting its profitability, solvency, liquidity, earnings, and turnover. Some of the most common and essential ratios are gross profit, debt to equity, inventory turnover, etc. It is helpful for both investors and creditors to make crucial business decisions like lending debts or making investments. Ratio analysis comes with both advantages and disadvantages. Even though they are efficient and valuable, it can only happen when the data is reliable and analysts use constructive techniques.
Ratio Analysis – FAQs
Q1. What is ratio analysis in management accounting? What are its types?
Answer: Financial ratio analysis in management accounting is a process of assessing the financial health of companies. It uses various ratios to estimate the business performing aspects. Therefore, it has five types: solvency, liquidity, earnings, profitability, and turnover ratios.
Q2. What are the objectives of ratio analysis?
Answer: The prime objective of performing ratio analysis is to gauge a company’s efficiency. Moreover, it can help evaluate the firm’s capacity to make profits, clear debts, utilize assets, etc. Therefore, it can all be attainable by analyzing the profitability, solvency, turnover ratios, etc.
Q3. Why is ratio analysis important?
Answer: Ratio analysis is essential for companies, lenders, and investors. While managements use analysis to plan schemes to improve business, lenders can find the solvency value useful for allocating loans. Hence, investors can decide to invest or discover how much their previous investments are making.
Q4. How do we interpret ratio analysis?
Answer: Analysts prefer to use their interpretation methods to analyze companies. However, the basic interpretation is examining the current financial statements to their historicals. Therefore, the conclusive reports are compared across time for the same firm and similar companies.
Q5. What is hazard ratio analysis?
Answer: Hazard ratio (Hr) analysis helps determine the probability of an event occurring again. Moreover, it calculates how long an asset can be of service or which product can fail in the markets. However, in finance, analysts mostly use the risk ratio for estimating the possibility of loss.
Recommended Articles
Although this article guides you through the meaning, purpose, and various types of ratio analysis, we also learn its advantages and disadvantages. To learn more about Ratio analysis, you can visit the following links.


