Updated February 6, 2023
Excel Quick Analysis Tools
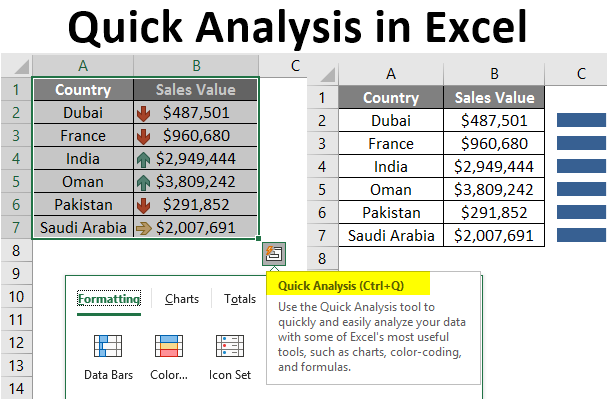
Excel is a very handy tool where it comes out to play across numbers and draws meaningful insights out of those. However, sometimes it is difficult to get the meaning out of numbers when you have a lot of rows and columns involved. It makes an analyst’s life difficult as it is his job to find out meaningful insights in a laymen’s language and present those to the management in digestible blocks. Excel has some features which can be helpful for you to draw insights from the data spread across multiple rows and columns. One such feature is the Quick Analysis tool. It allows you to apply conditional formatting quickly and add different charts, including bar, column, line, etc.
Excel Quick Analysis (Table of Contents)
How to Use Quick Analysis Tool in Excel?
Excel Quick Analysis tool can be used to quickly analyze the data you have by inserting charts or bars and conditional formattings. All you need to do is, select all the data ranges and you can see a quick analysis tool at the end of the selection. You can also hit CTRL + Q to navigate the quick analysis tool.
Let’s understand how to use the Quick Analysis Tool in Excel with a few examples.
Example #1 – Excel Quick Analysis Tool to Apply Conditional Formatting
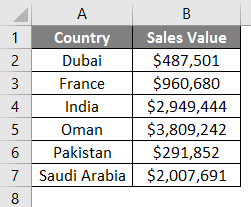
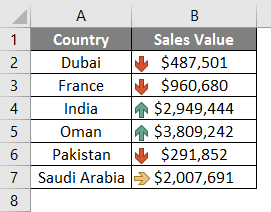
Suppose we have country-wise sales data as shown in the screenshot below.
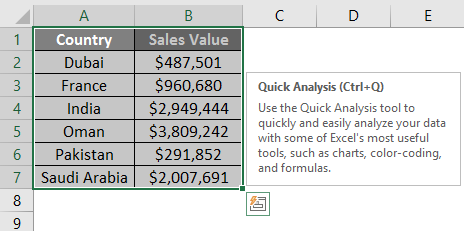
Step 1: Select all the data across A1:B8 and click on the Quick Analysis tool at the bottom of the selection or hit CTRL + Q to launch the quick analysis tool.
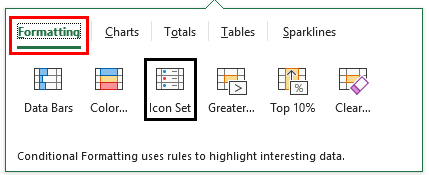
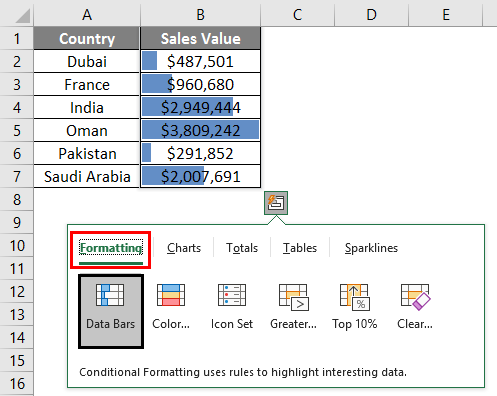
Step 2: As soon as you click on the Quick Analysis toolbar, you’ll be able to see different options under it named Formatting, Charts, Totals, Tables, and Sparklines. Each option has different sub-options that allow you to do different analytical operations. Navigate to Formatting and choose the Icon Set operation under it. This option enables you to set the icons for the data.
Step 3: Once you click on and select the Icon Set option, you’ll be able to see the icon set assigned to your data and it will look like the screenshot given below.
You also can choose different formatting options like the one named Data Bars.
Step 4: Select the Data Bars option under Formatting and it will add data bars across the cells with numeric values for the data.
Example #2 – Adding Charts Associated With the Data
Now, we would like to add the chart under this data.
Step 1: As in Example 1, select all of the data from A1 to B8 and navigate through the Charts option in the Quick Analysis toolbox, which can be accessed at the end of the selection or by pressing CTRL + Q after the selection. You can see different chart options available.
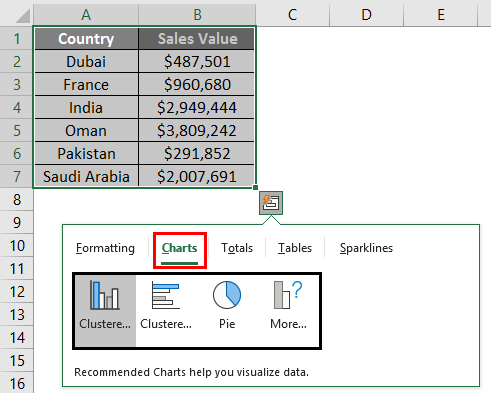
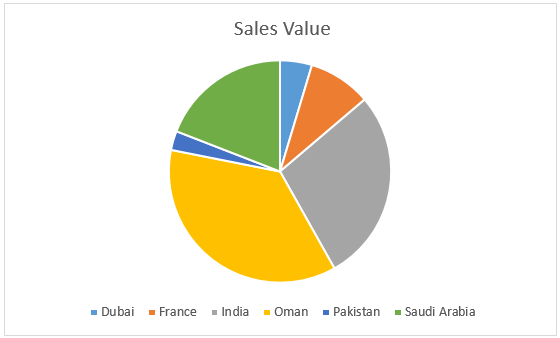
Step 2: Select an appropriate chart that can represent this data. You can select out of the given list or can see the more charts option as well. I will click on the Pie chart for the data. 
Step 3: The output is shown below after clicking on Pie Chart.
Example #3 – Adding Total to The Data
Often it is good to have total or averages to get an analytical overview of the data. Quick Analysis allows you to do so as well.
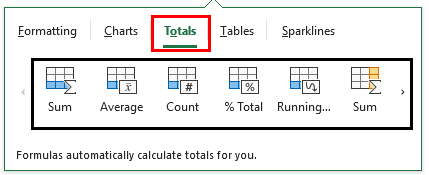
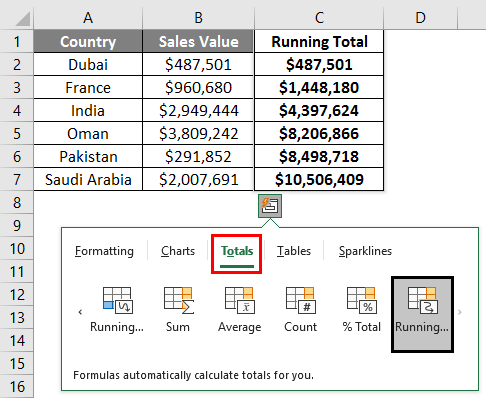
Step 1: Follow the same step we did in examples 1 and 2. Select the data and navigate to Quick Analysis Tool. There, select the Totals option, and you’ll see different sub-options like sum, average, etc.
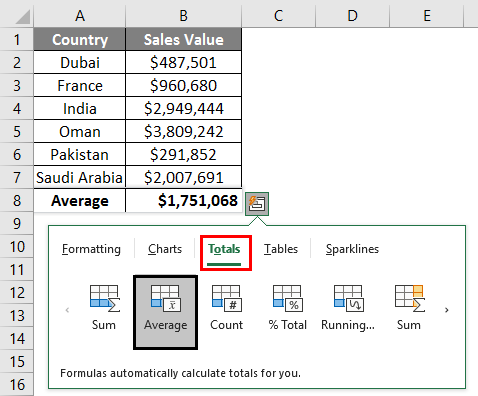
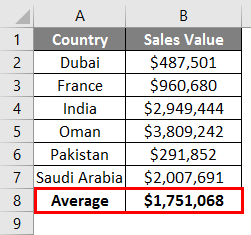
Step 2: Click on the Average button inside the Totals option to calculate the average sales based on the data provided. You can see the average of all the cell’s value under cell B8.
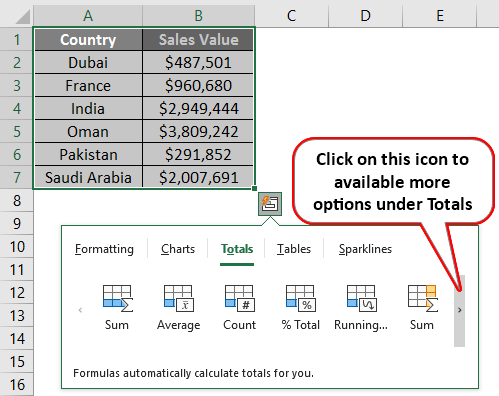
Step 3: We would like to explore more options under the Totals section. Click on the navigation bar present on the right-hand side, it will load more sub-options under Totals.
Step 4: Select the Running Total across rows option and it will calculate the running total across all the rows. See the screenshot below.
Example #4- Adding Tables and Pivots using Quick Analysis Tool
We also can add the tables and pivots using Quick Analysis Tool.
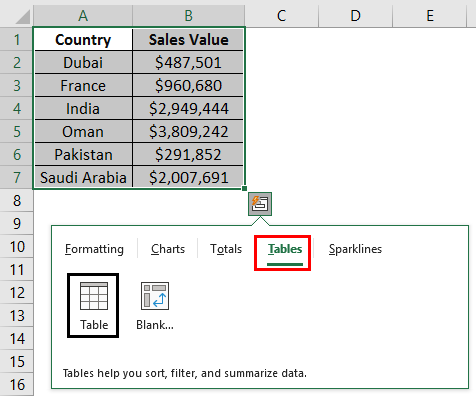
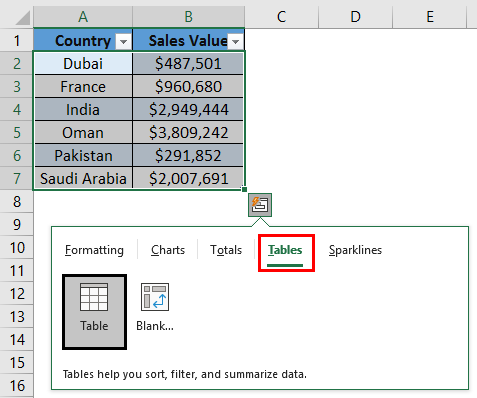
Step 1: Navigate to the Quick Analysis Toolbar and go to the Tables option to add the tables and pivots. Select Table there and you can see the table has been added under the selected cells of data.
Step 2: Navigate towards the Tables section again and this time select the Blank… option. This option adds the pivot table on a new excel sheet for the selected range of data.
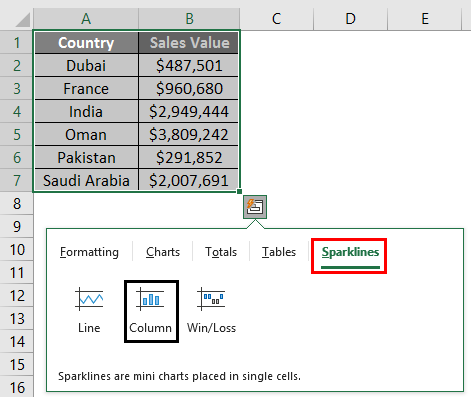
Example #5 – Add Sparklines using Excel Quick Analysis Tool
You can also add the Sparklines using Quick Analysis Tool in excel.
Step 1: Select all the data and navigate toward the quick analysis tool where you can see an option named Sparkline, click on that. This option itself has different sub-options for sparklines.
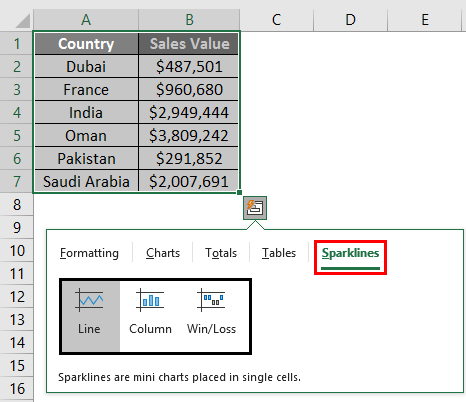
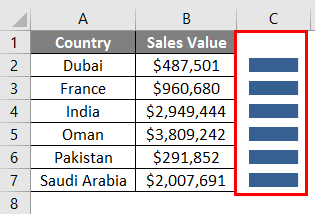
Step 2: Click on Column, it enables you to add the Sparkline chart with Columns. The chart will be placed in a column beside the last column with data (in this case the sparklines will be added under column C).
The output will be like in the screenshot shown below.
This is how we can use the Quick Analysis Tool under Excel. We have covered all the options available under the Quick Analysis toolbox. However, you can always navigate through the options and practice for yourself. Let’s wrap the article with some points to remember.
Things to Remember
- You can hit CTRL + Q to navigate toward the Quick Analysis or can select all the data and can see the Quick Analysis box at the end of the selection.
- Since it is a Quick Analysis tab, you can’t expect it to be having customization for different options such as graphs and conditional formatting. However, you can always change/customize the layout using the Design tab.
Recommended Articles
This is a guide to Quick Analysis in Excel. Here we discuss how to use Quick Analysis Tool in Excel, practical examples, and downloadable excel templates. You can also go through our other suggested articles –
