Updated March 16, 2023
Introduction to QlikView Aggr
Aggr() is a very authoritative type of function in QlikView that approaches innovative aggregation, delivering unlimited flexibility to the designer and the consumer. QlikView Aggr() functions are implemented for producing an aggregate or a bundle of data records from the table rows, applying statistical or mathematical operations together on loading massive data. Based on actions performed on data by this aggr() function, some types or subcategories of this QlikView function are available. These functions can be used while loading the data files to the table fields in the QlikView script editor. The essential aggregate functions are AVG, SUM, MIN, MAX, ONLY, COUNT, CONCAT, FRACTILE, CORREL, SKEW, STDEV, MEDIAN & so on.

How to Use QlikView Aggr?
We can learn and practice this QlikView aggr functions using the GROUP BY clause implemented on the table records available in the database.
Some aggregate functions can be applied as follows, taking the data stored in the local system named as productsales.csv table:
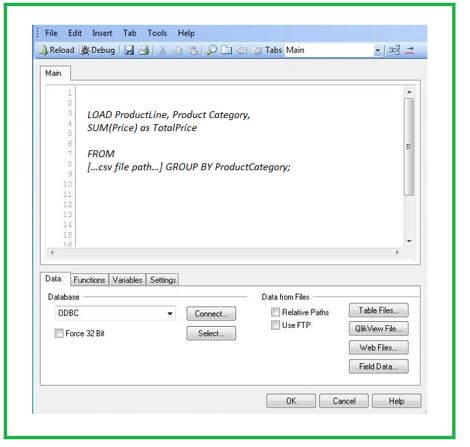
SUM() function provides the sum value of all the numeric data of the table column.
Code:
SUM(Price) as TotalPrice FROM […csv file path…] GROUP BY ProductCategory;Output:
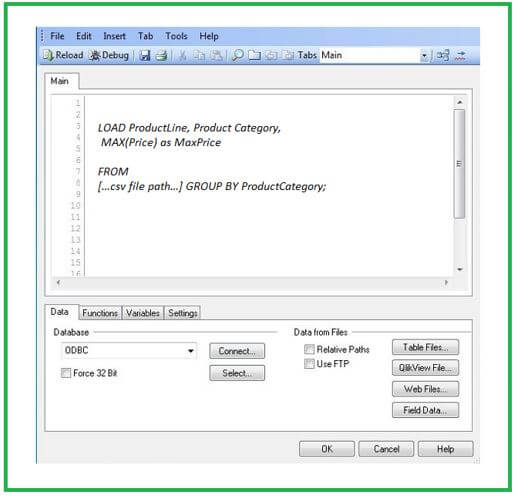
MAX() function provides the maximum value of the table column’s numeric data.
Code:
MAX(Price) as MaxPrice FROM […csv file path…] GROUP BY ProductCategory;Output:
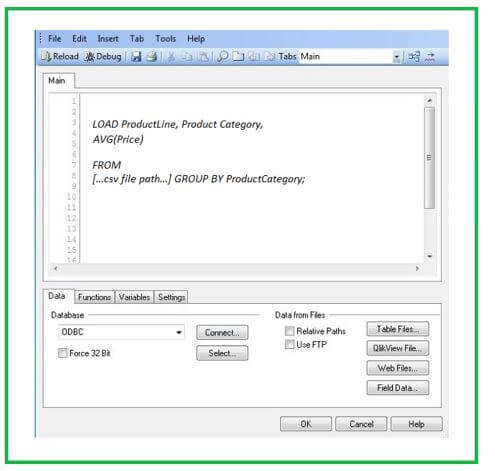
AVG() function provides the average value of the table column’s numeric data.
Code:
AVG(Price) FROM […csv file path…] GROUP BY ProductCategory;Output:
MIN() function provides the average value of the table column’s numeric data.
Code:
MIN(Price) as MinPrice FROM […csv file path…] GROUP BY ProductCategory;Output:

The csv table contains sales figures for many product lines and categories.
QlikView Aggr Function
In QlikView, Aggr() function arises under progressive aggregation and delivers outstanding flexibility to the clients and programmers.
This aggr() function will:
- Allows executing aggregation performed over a group of scopes.
- It assists in creating a type of a temp named table containing meaningful results, using which one can choose and execute further aggregations.
- Permits to apply with dimensions and expressions.
- The output of the Aggr() function may be implemented in a few other aggregated functions.
- It is comparable to the clause GROUP BY available in SQL.
- It is comparable to the chart expression centered on many chart dimensions.
- If Aggr() is not present, you may be required to write complex scripts or even SQL queries to gain related results.
- This aggr function helps select or control the table fields. It narrows the selection of fields.
- It is a heavyweight resource user type and will slow down the application. Thus, implement only when necessary and ignore applying or targeting the effect in big applications. For slow performance, the calculated dimensions are also the source’s primary reason, so pre-calculates the table fields when possible in the script.
- The QlikView aggr function results in an array consisting of values calculated over the defined dimensions for the expression. For instance, maximum values performed per customer and per location of fields of the table.
Types of QlikView Aggr
Different types are mentioned below:
1. Basic Aggregation Functions
Here, we can use a table’s data record for experimenting with the QlikView Aggr() function.
- SUM([distinct] {Expr}): Being defined by the clause named GROUP BY, the sum function will return the sum of table records specified to a field provided. You can disregard the replicates just by using the term DISTINCT before the term Expression(Expr) is defined.
- MIN(Expr, Rank): As defined by the clause named GROUP BY, the MIN function will return the smallest numeric value in the entire table records. If the Rank has a default value of 1, it corresponds to the lowermost value. Similarly, if the value is provided as 2, it will give the second lowermost value.
- MAX(Expr, Rank): As defined by the clause named GROUP BY, the MAX function will return the highest numeric value upon the entire table records. If the Rank has a default value of 1, it corresponds to the uppermost value. Similarly, if the value is provided as 2, it will give the second uppermost value, and so on.
- ONLY(Expr): When an expression includes only a single numeric value, that value is provided as output in this function. Otherwise, the NULL is returned.
- MODE(Expr): It outputs the mode value over many records, which is the best frequently arising value of the expression. We will get NULL if more than one value is occurring similarly frequently. We can use this function to output either text values or numeric values.
- Firstsortedvalue(Expr, sort-weight, n): When any expression is repeated over several data records, this function provides the initial value of the expression sorted by the equivalent sort-weight.
2. String Aggregate Functions
It is the second form of QlikView Aggregate functions with subcategories as:
- MinString(Expr)
- MaxString(Expr)
- FirstValue(Expr)
- LastValue(Expr)
- Concat(Expr, delimiter, sort-weight)
3. Counter Aggregation Functions
- Count({Distinct} Expr | *)
- NumericCount(Expr)
- TextCount(Expr)
- NullCount(Expr)
- MissingCount(Expr)
- Advanced Aggregation
4. Statistical Aggregation Functions
- Fractile(Expr, Fractile)
- Kurtosis(Expr)
- Correl(X-Expr, Y-Expr)
- AVG(Expr)
- STDEV(Expr)
- SKEW(Expr)
- Median(Expr)
- Linest_m(y-expr, x-expr, [, y0 [, x0]])
- Linest_b(y-expr, x-expr, [, y0 [, x0]])
- Linest_r2(y-expr, x-expr, [, y0 [, x0]])
- Linest_a(y-expr, x-expr, [, y0 [, x0]])
5. Financial Aggregate Functions
- irr(expr)
- xirr(value expr, date expr)
- npc(rate, expr)
- xnpv(rate, value expr, date expr)
Conclusion
Most of the QlikView aggregate functions, which hold various fields, from elementary scientific to statistical and monetary functions, are covered here. You can apply and learn these QlikView Aggr() functions by practicing on the data records available in the database tables.
Recommended Articles
This is a guide to QlikView Aggr. Here we discuss the introduction and how to use QlikView aggr with function and types. You can also go through our other related articles to learn more –
