Updated April 5, 2023
Definition on PyTorch profiler
PyTorch has a simple profiler API that may be used to figure out which operators in a model are perhaps the priciest. A PyTorch Profiler is an open-source tool for analyzing and troubleshooting large-scale deep learning models with accuracy and efficiency. This new tool, which was created as part of a partnership between Facebook and Microsoft, allows for accurate and rapid performance evaluation in massive deep learning models.
What is the new PyTorch profiler?
The new PyTorch Profiler (torch. profiler) is a tool that integrates both forms of data and then creates an interface that maximizes that data’s capabilities. This new profiler gathers together GPU hardware and PyTorch-related data, correlates it, detects obstacles in the model automatically, and generates recommendations as to how to overcome them. When many profiler ranges are present simultaneously (for example, in simultaneous PyTorch threads), each profiling context manager only tracks the operators of the range to which it belongs. The Profiler makes use of a new GPU profiling engine that is based on Nvidia CUPTI APIs and can record GPU kernel activities with great fidelity. Embed the code in the profiler context manager to profile any model training loop.
Using performance tool
The new Profiler API is directly enabled in PyTorch and provides the most pleasant experience to present; users may characterize their models without installing other packages by utilizing the PyTorch Profiler module.
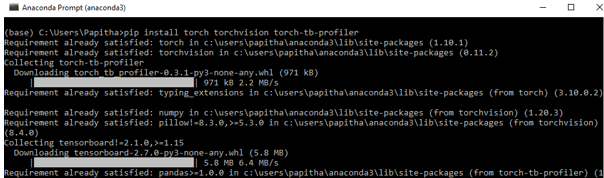
Use the command prompt to install torch and torch vision:
pip install torch torchvisionPyTorch Profiler has five primary features.
1. View from a distance option
2. Viewing Memory space
3. Use of the graphics processing unit
4. Support for cloud storage
5. Go to the code for the course
Memory Capability:
To activate memory monitoring capability by supplying profile memory=True to PyTorch profiler, that logs the memory space (used by the model’s tensors) that’s been assigned (or freed) during the performance of the model’s operator.
with profile (activities= [ProfilerActivity.CUDA],
profile_memory=True, record_shapes=True) as pr:
model(inputs)
print(pr.key_averages(). table(sort_by="CUDA memoty", row_limit=10))
PyTorch profiler performance tool
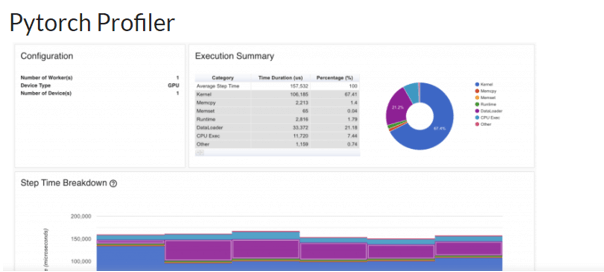
It is a software that collects performance information during learning and inference processes. The context controller API in Profiler may be used to figure out which model functions are the most pricey, look at their input forms and stack traces, investigate device kernel activity, and display the performance trace.
This new technique, which was developed as part of a Facebook-Microsoft collaboration, enables accurate and speedy performance review in enormous deep learning models. Users may use this API to profile their models without having to install any additional packages, and the outputs will appear in Tensor Board right away thanks to the recent PyTorch Profiler plugin.
torch.profiler.ProfilerAction(value)
torch.profiler.schedule(*, wait, warmup, active, repeat=0, skip first=0),
Gives a callable that can be used as a scheduling argument in a profiler. The profiler will ignore the initial skip first phases, then stop for wait steps, then warm-up for the next warmup steps, record the next active steps, and then reboot the cycle starting with wait steps. The repeat parameter specifies the number of cycles to run; a value of zero indicates that the cycles will run until the profiling is complete.
The PyTorch profiler allows several settings. The following are some of the most important parameters to consider while analyzing the execution time:
- record shapes: whether or not the forms of the operator inputs should be recorded;
- profile memory: whether or not to publish the model’s Tensors memory usage.
- _cuda: whether or not to monitor CUDA kernel processing time.
To profile the model building loop, enclose the code with the profiler’s context manager. Here is the context.
with torch.profiler.profile(
schedule=torch.profiler.schedule(
wait=3,
warmup=3,
active=5,
repeat=2),
on_trace_ready=tensorboard_trace_handler,
with_trace=True
) as profiler:
for st, dt in enumerate (trainloader, 0):
print("st:{}".format(st))
inputs, labels = dt[0].to(device=device), dt[1].to(device=device)
outputs = model(inputs)
loss = criterion(outputs, labels)
optimizer.zero_grad()
loss.backward()
optimizer.step()
profiler.step()
Example performing Execution time with Profiler
import torch
import torchvision.models as models
from torch.profiler import profile, record function, Profiler Activity
use_cuda = torch.cuda.is_available()
device = torch.device("cuda:0" if use_cuda else "cpu")
model = models.resnet18().to(device)
inputs = torch.randn(5,3,212,212).to(device)
with profile(activities=[
ProfilerActivity.CPU, ProfilerActivity.CUDA], record_shapes=True) as prof:
with record_function("model_inference"):
model(inputs)
print(prof.key_averages().table(sort_by="cpu_time_total", row_limit=8))
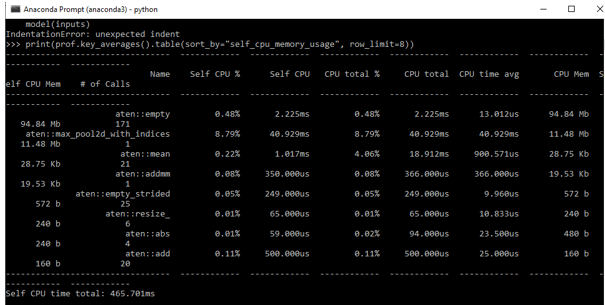
with profile(activities=[ProfilerActivity.CPU, ProfilerActivity.CUDA],
profile_memory=True, record_shapes=True) as prof:
model(inputs)
print(prof.key_averages().table(sort_by="self_cpu_memory_usage", row_limit=8))Output:
To increase the batch size for optimization, do the following:
train loader = torch.utils.data.DataLoader(train set, batch size=32, shuffle=True, num workers=4)Then modify the trace handler argument to save the results to a new folder:
Then re-run the software. Switch the “run” option on Tensor Board and restart it.
PyTorch profiler Feature and update
Features and advantages:
The PyTorch Profiler (torch. profiler) is a toolkit that can record information about PyTorch activities as well as extensive GPU hardware data.
The following are some of PyTorch Profiler’s benefits:
- To obtain insight into how a model’s activities are carried out.
- To examine and improve deep learning systems’ efficiency.
- The goal is to examine the performance profile.
- Follows the advice to identify bottlenecks and eradicate them.
- Allows a user to examine the costs of different operators within the model on both the CPU and GPU.
- To determine how much time and storage the model’s operators consume.
Here are a few of the upgrades and changes:
- Support for the Kineto platform has been expanded.
- Fixed a problem with CUDA activity flushing that occurred on occasion.
- Empty trace was handled.
- Cuda synchronization points have been added.
- FLOPs are now printed twice.
- Fallbacks for CUDA events and profilers have been included.
- GPU Usage Visualization ensures that your GPU is pushed to its maximum and completely exploited, ensuring that the computer isn’t idle. The Tensorboard plugins now have support for reading profiling data from Azure Blob Storage, Amazon S3, and Google Cloud Platform.
- Jump to Source Code is a terrific major update that allows users to view clear what’s happening in the code and jump straight into it.
Conclusion
The profiler’s goal is to identify processing stages that consume a lot of time or memory, and then show where there might be a problem on the system with GPUs or CPUs. Therefore we have seen how the profiler works in Pytorch. Here I have used Anaconda3 and tensor board for the visualization.
Recommended Articles
We hope that this EDUCBA information on “PyTorch profiler” was beneficial to you. You can view EDUCBA’s recommended articles for more information.
