Updated July 25, 2023

Introduction to Profit Margin
The term “profit margin” refers to the profitability measure that assesses the financial benefit earned relative to the overall sales. In other words, the metric gauges what portion of the sales has been converted into profit or how much profit has been generated for each dollar of sale.
There are several types of metrics, and some of their major variants are:
- Gross Profit Margin(GPM)
- Operating Income Margin
- Net Income Margin
Formula
The formula can be derived by dividing the total sales and its associated total expenses by the total sales and then expressed in percentage.
Mathematically, it is represented as:
It is to be noted that the total expenses are an umbrella term that will include the cost of sales for gross profit margin, operating expenses for operating profit margin, and all the expenses for net profit margin.
Examples of Profit Margin
Let’s take an example to understand the calculation in a better manner.
Example #1
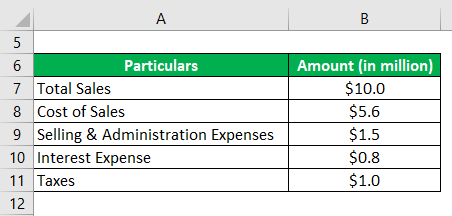
Let us take the example of an entity ASD Inc. that is in the retail food chain business. During the year ended on December 31, 2018, the company achieved total sales of $10.0 million while incurring a cost of sales of $5.6 million, selling & administrative expenses of $1.5 million, interest expense of $0.8 million, and taxes of $1.0 million. Calculate the gross profit margin, operating income profit, and net income margin of the company for the year 2018 based on the given information.
Solution:
Operating Expenses are calculated using the formula given below.
Operating Expenses = Cost of Sales + Selling & Administration Expenses
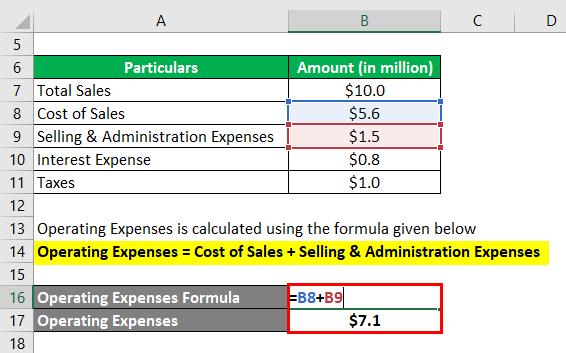
- Operating Expenses = $5.6 million + $1.5 million
- Operating Expenses = $7.1 million
Total Expenses are calculated using the formula given below.
Total Expenses = Operating Expenses + Interest Expense + Taxes
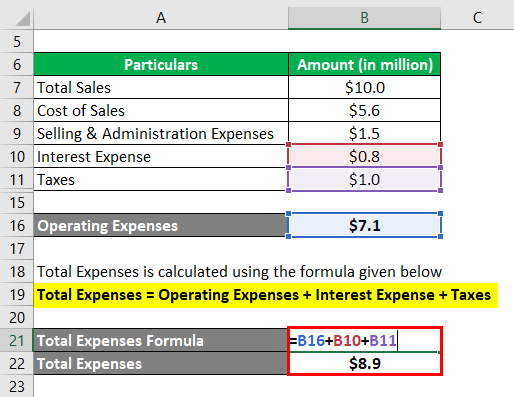
- Total Expenses = $7.1 million + $0.8 million + $1.0 million
- Total Expenses = $8.9 million
Gross Profit Margin is calculated using the formula given below.
GPM = (Total Sales – Cost Sales) / Total Sales * 100

- GPM = ($10.0 million – $5.6 million) / $10.0 sales * 100
- GPM = 44%
Operating Income Margin is calculated using the formula given below.
Operating Income Margin = (Total Sales – Operating Expenses) / Total Sales * 100

- Operating Income Margin = ($10.0 million – $7.1 million) / $10.0 sales * 100
- Operating Income Margin = 29%
Net Income Margin is calculated using the formula given below.
Net Income Margin = (Total Sales – Total Expenses) / Total Sales * 100
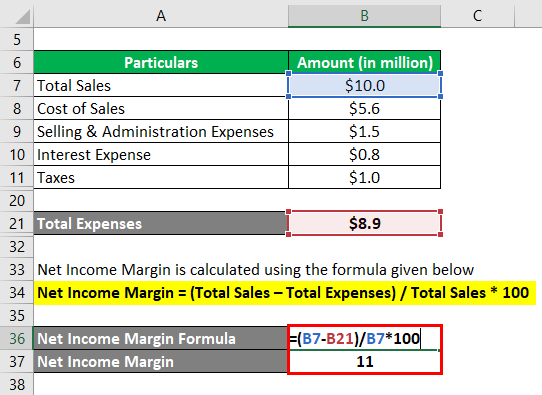
- Net Income Margin = ($10.0 million – $8.9 million) / $10.0 sales * 100
- Net Income Margin = 11%
Therefore, the GPM, operating income profit, and net income margin of the company for the year 2018 stood at 44.0%, 29.0%, and 11.0%, respectively.
Example #2
Let us take the example of Walmart Inc. to illustrate the concept of a real-life company. According to the annual report for the year 2018, the following information is available,
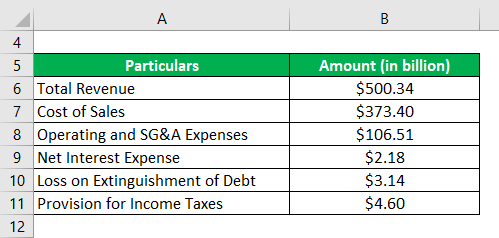
Calculate the gross profit margin, operating income profit, and net income margin of Walmart Inc. for the year 2018 based on the given information.
Solution:
Operating Expenses are calculated using the formula given below.
Operating Expenses = Cost of Sales + Operating and SG&A Expenses
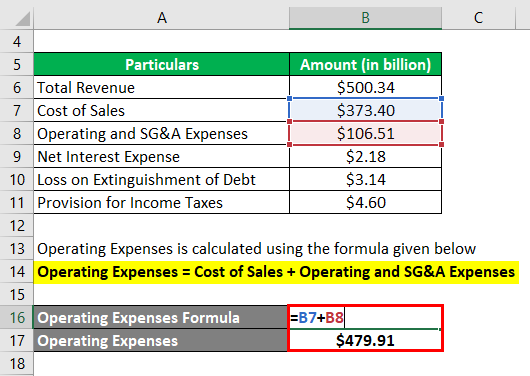
- Operating Expenses = $373.40 billion + $106.51 billion
- Operating Expenses = $479.91 billion
Total Expenses are calculated using the formula given below.
Total Expenses = Operating Expenses + Net Interest Expense + Loss on Extinguishment of Debt + Provision for Income Taxes
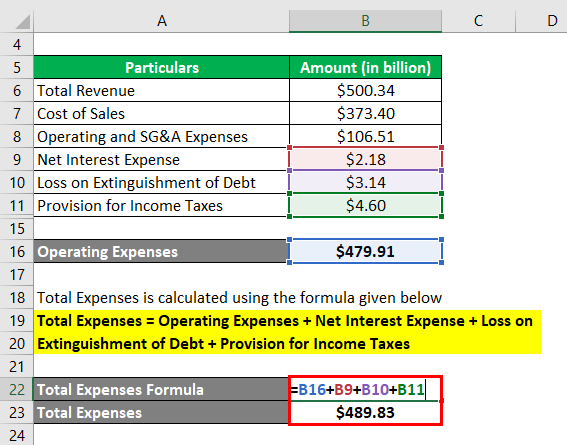
- Total Expenses = $479.91 billion + $2.18 billion + $3.14 billion + $4.60 billion
- Total Expenses = $489.83 billion
Calculate using the formula given below.
GPM = (Total Revenue – Cost Sales) / Total Revenue * 100
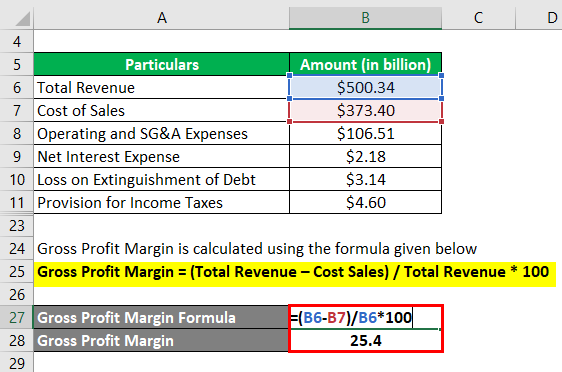
- GPM = ($500.34 billion – $373.40 billion) / $500.34 billion * 100
- GPM = 25.4%
Operating Income Margin is calculated using the formula given below.
Operating Income Margin = (Total Revenue – Operating Expenses) / Total Revenue * 100
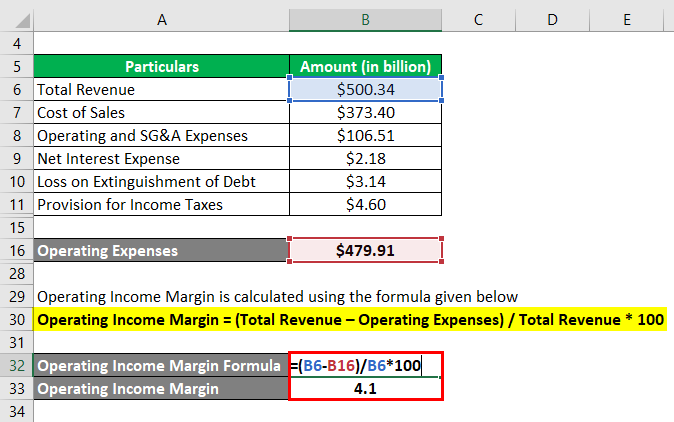
- Operating Income Margin = ($500.34 billion – $479.91 billion) / $500.34 billion * 100
- Operating Income Margin = 4.1%
Net Income Margin is calculated using the formula given below.
Net Income Margin = (Total Revenue – Total Expenses) / Total Revenue * 100
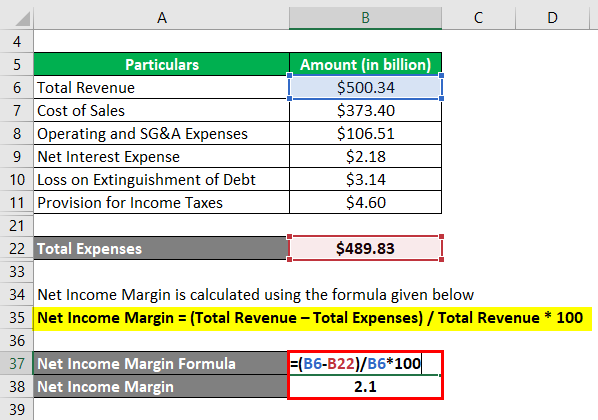
- Net Income Margin = ($500.34 billion – $489.83 billion) / $500.34 billion * 100
- Net Income Margin = 2.1%
Therefore, the GPM, operating income profit, and net income margin of Walmart Inc. for the year 2018 stood at 25.4%, 4.1%, and 2.1%, respectively.
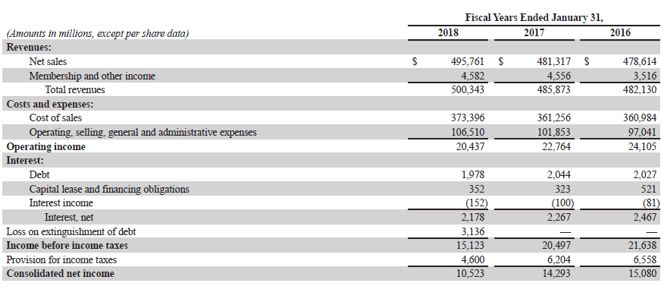
Source: Walmart Annual Reports (Investor Relations)
Advantages and Disadvantages of Profit Margin
Some of the advantages & disadvantages are as follows:
Advantages
- It indicates the cost efficiency of a company and helps track its performance across time periods.
- It helps in assessing the financial health of a company and facilitates peer comparison on that basis.
Disadvantages
- If used to compare companies across different industries or sectors, then may lead to meaningless insights.
- It is exposed to the risk of manipulation.
Conclusion
So, it can be concluded that it is the most important metric for financial analysis as it indicates the cost efficiency of a company that can be used for trend analysis and peer comparison. However, one has to be careful while using the margins as they can be manipulated to reflect overstated margins.
Recommended Articles
This is a guide to the Profit Margin. Here we discuss how profit margin can be calculated using a formula, the advantages and limitations of profit margin, and a downloadable excel template. You can also go through our other suggested articles to learn more –

