Updated August 21, 2023
Poisson Distribution in Excel (Table of Content)
- Overview of Poisson Distribution Function in Excel
- How to Use Poisson Distribution Function in Excel?
Overview of Poisson Distribution in Excel
The following Poisson Distribution in Excel outlines Excel’s most commonly used functions. It is a pre-built integrated probability distribution function (pdf) in excel that is categorized under Statistical functions.
It is used to calculate revenue forecasting.
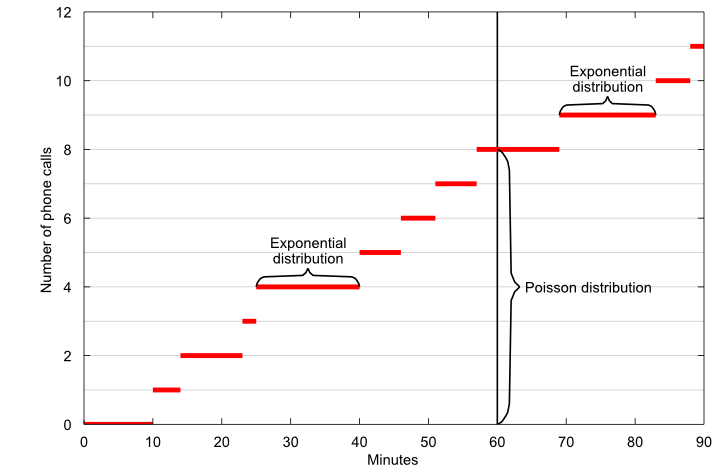
It is related to the exponential distribution. It is the number of occurrences of an event in a given unit of time, distance, area, or volume, E.g.
a) No occurrence of bike accidents in a day. Here, the number of occurrences of the event is a Poisson random variable; it is unpredictable & Unknown; events occur randomly & independently.
b) The number of phone calls received by a call center agent in a 60-minute fixed time frame.
c) The number of flaws in a bolt of fabric.
d) The number of errors on each document page may be spelling or other errors.
The Poisson probability mass function calculates the probability of x occurrences, and the below-mentioned statistical formula calculates it:
P ( x, λ) = ((e−λ) * λ x) / x!
Here,
- λ (Lambda) is the expected number of occurrences within the specified time period.
- X (random variable) is said to be a Poisson random variable with parameter λ.
- e is similar to pi, a constant mathematical base of natural logarithms approximately equal to 2.71828.
- x! which is called an x factorial, e.g., 5 factorials would be 120, which is calculated as
5! =5x4x3x2x1 = 120
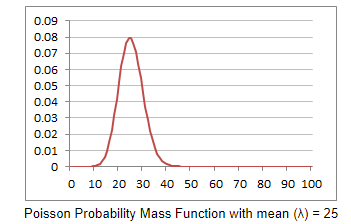
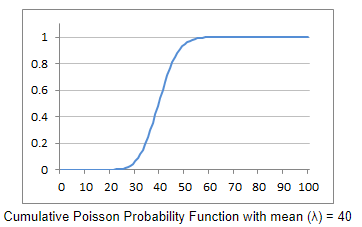
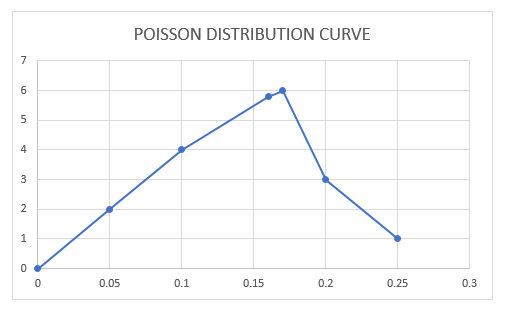
Poisson Distribution Curves for Probability Mass & Cumulative
Explanation of Poisson Distribution Function in Excel
It uses it to estimate or predict the probability of a specified number of occurrences of events over a specified interval of time or space.
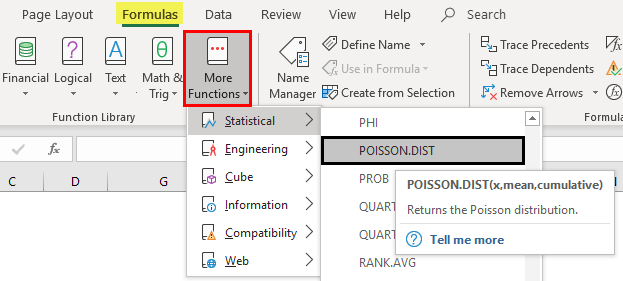
The syntax or formula for the Poisson distribution function in Microsoft Excel is:
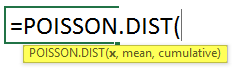
The POISSON.DIST function syntax or formula has the below-mentioned argument:
- x: it is the total number of events whose probability of occurrences will be calculated.
This value should be an integer; If a decimal is supplied, it will truncate to an integer by Excel.
- Mean: The expected number of events to occur (Note: it must be ≥ 0).
- Cumulative: A logical argument specifying the distribution type to be calculated.
Here the type of distribution may be, or It can be either of the below mentioned:
- TRUE or 1 – Use the cumulative distribution function or
It will return the cumulative probability of the event x or less happening.
- FALSE or 0 – Use the probability mass or density function.
i.e., Excel will return the probability of only x number of events happening.
How to Use Poisson Distribution Function in Excel?
With examples, let’s look at how the Poisson Distribution function works in Excel.
Example #1 – Calculating Probability Mass or Density Function
Suppose an outbound call center agent has made 5.8 telephonic calls per minute; here, the occurrence of the calls can predict through or by POISSON distribution. Let’s check out how to calculate the cumulative distribution function & probability mass or density function.
Now, we can calculate the probability mass or density function using the Poisson Distribution function.
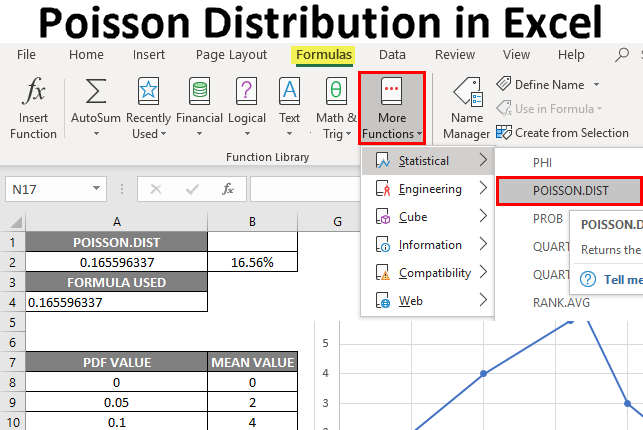
- Select the cell where the Poisson Distribution Function needs to be applied to calculate cumulative distribution, i.e., “A2.”
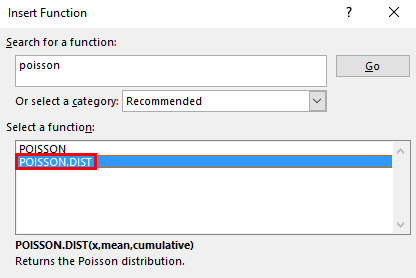
- Now click on the insert function button (fx) under the formula toolbar at the top of the Excel sheet. Now the dialog box will appear, where you should enter the keyword “POISSON” in the search for a function box; two types of Poisson equations appear. In that, you need to select the Poisson Distribution function.
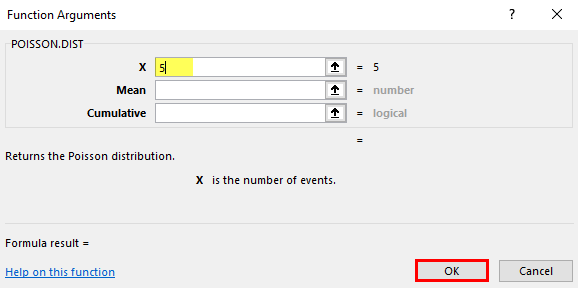
Suppose the call center agent made exactly 5 phone calls in 1 minute.
X = 5, the total number of events whose probability of occurrence will be calculated.
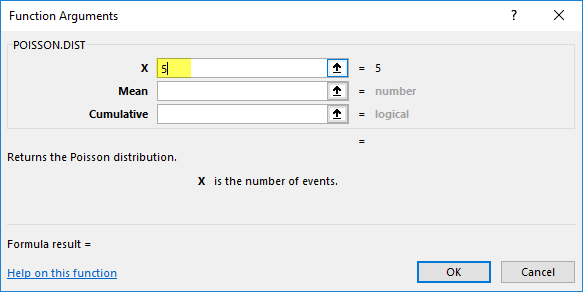
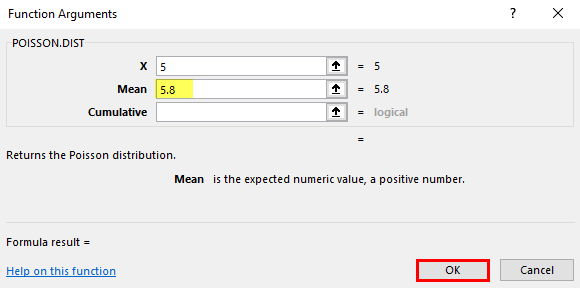
Mean = 5.8, which is the expected number of events to occur.
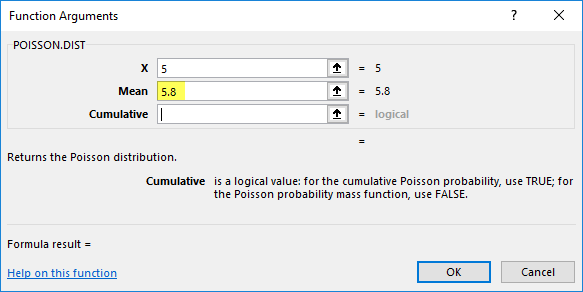
Cumulative: A logical argument specifying the distribution type to be calculated.
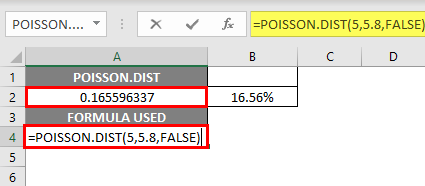
- Here the type of distribution to find out is probability mass or density function. It will return the probability of only x number of events happening. Therefore cumulative = false or 0 (probability density function).
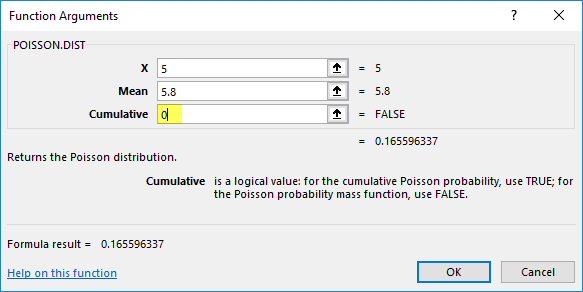
- The Poisson Distribution function returns the probability mass or density function value, i.e., 0.165596337, where you need to convert it to percentage, which results in 16.55%.
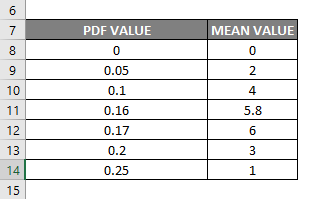
With the above value, if I plot a graph for probability mass or density function, i.e., phone calls per minute on the Y-axis (Mean values) & of probability mass or density value on the X-axis (Pdf values), it appears as mentioned below.
Poisson Distribution Curve for Probability Mass or Density Function
Similarly, we can calculate cumulative distribution with the help of the Poisson Distribution function.
Example #2 – Calculation of Cumulative Distribution
Suppose a call center has made up to 5 calls in a minute.
To calculate cumulative distribution with the help of the Poisson Distribution function, the only change that needs to be done is the cumulative argument in the Poisson Distribution function is set as the TRUE value instead of false.
- Select the cell where the Poisson Distribution Function needs to be applied to calculate cumulative distribution, i.e., “D6.”
- Now click on the insert function button (fx) under the formula toolbar at the top of the Excel sheet. Now the dialog box will appear, where you should enter the keyword “POISSON” in the search for a function box; two types of Poisson equations appear. In that, you need to select the Poisson Distribution function.
Suppose the call center agent made exactly 5 phone calls in 1 minute.
X = 5, the total number of events whose probability of occurrence will be calculated.
Mean = 5.8, which is the expected number of events to occur.
Cumulative: A logical argument specifying the distribution type to be calculated.
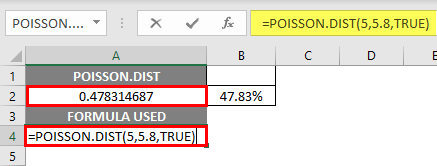
Here the type of distribution to find out is CUMULATIVE. Therefore cumulative = TRUE or 1 Cumulative density function (CDF).
Excel will return the cumulative probability of the event x or less happening.
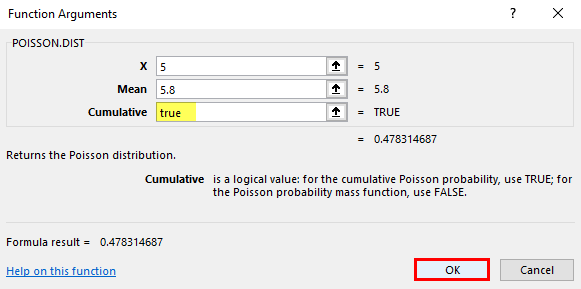
The Poisson Distribution function returns the value of cumulative distribution, i.e., 0.478314687, where you need to convert it to percentage, which results in 47.83%.
Things to Remember
- If the value of X or the mean value is lesser than zero in the Poisson Distribution function, then the #NUM error occurs.
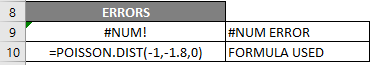
- If any argument in the Poisson Distribution function is non-numeric, then #VALUE! error
![]()
- X value in the Poisson distribution function should always be an integer; if you enter a decimal value, it will be truncated to an integer by Excel.
Recommended Articles
This is a guide to Poisson Distribution in Excel. Here we discuss How to Use the Poisson Distribution Function in Excel, examples, and a downloadable Excel template. You may also look at the following articles to learn more –
