
Introduction to Pandas Boxplot
Data scientists and analysts rely heavily on data visualization to uncover patterns and insights that may go unnoticed in datasets. Boxplots are particularly noteworthy among the array of visualization tools and techniques available, offering a simple yet effective method for understanding data distribution.
A boxplot, a box-and-whisker plot, provides a concise overview of a dataset’s distribution, emphasizing necessary statistical measures like the median, quartiles, and potential outliers. This visual representation gives a rapid overview of the data’s central tendency and variability but also aids analysts in detecting any skewness or asymmetry within the distribution.
Table of Contents:
Syntax:
pandas.boxplot(by=None,column=None, fontsize=None,ax=None, grid=True, rot=0, layout=None,figuresize=None, return_type=None, **kwds)In this syntax,
- By: This parameter determines which column or columns will group the data before plotting. It accepts either a single column name or a list of column names. The function generates separate boxplots for each group when you specify it.
- Column: This parameter specifies the column name or list of column names to plot. If “by” is not specified, “column” is used to select the data for plotting.
- Fontsize: This parameter sets the font size for labels and tick marks on the plot.
- Ax: This parameter specifies the matplotlib axes object where the plot will render. If not provided, create a new figure and axes.
- Grid: This parameter controls the display of gridlines on the plot. It is set to True by default.
- Rot: This parameter determines the rotation angle of the x-axis labels in degrees.
- Layout: This parameter defines the layout of subplots as a tuple (rows, columns). You use it when plotting multiple boxplots within a single figure.
- Figuresize: This parameter specifies the size of the figure in inches as a tuple (width, height), determining the dimensions of the plot.
- Return_type: This parameter specifies the format of the returned object. Set it to ‘dict’ to get a dictionary containing matplotlib axes and column names as keys object as values or ‘axes’ to return the matplotlib axes object.
- **Kwds: This parameter permits passing additional keyword arguments to the underlying matplotlib plotting function. You can utilize these arguments to customize various plot aspects, including line styles, colors, and marker styles.
What is Boxplot?
A boxplot, also referred to as a box-and-whisker plot, is a statistical visualization tool utilized to summarize the distribution of a dataset. It concisely depicts important descriptive statistics such as the median, quartiles, and potential outliers.

The boxplot consists of several components:
- Box: The central rectangle of the plot symbolizes the interquartile range (IQR), which extends from the upper quartile to the lower quartile. Consequently, the length of the box encapsulates the middle 50% of the data. The line within the box indicates the median value of the dataset.
- Whiskers: The whiskers extend from the edges of the box to depict the range of the data. By default, the whiskers typically stretch 1.5 times the interquartile range (IQR) from the quartiles. Data points beyond this range are deemed potential outliers.
- Outliers: Individual data points that fall beyond the whiskers are represented as individual points and are considered outliers. These points may indicate variability or extreme values within the dataset.
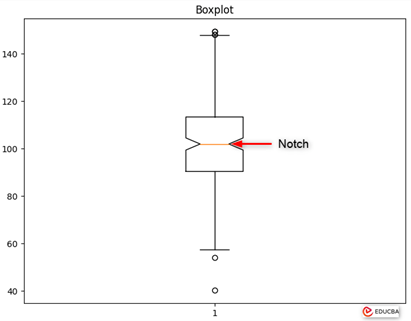
- Notch: In some boxplots, a notch appears in the center of the box. The width of this notch visually indicates the uncertainty around the median. When the notches of two boxplots do not overlap, it implies that the medians are significantly different at a certain confidence level.
Why Use Pandas for Boxplot?
Pandas, a widely used Python library for data manipulation and analysis, offers many tools and functionalities that simplify structured data handling. When it comes to generating boxplots, Pandas offers several advantages that position it as a preferred choice for data analysts and scientists:
- Integration with DataFrames: Pandas smoothly integrates boxplot functionality with its DataFrame data structure. This seamless integration allows users to create boxplots directly from their data, eliminating the need for extensive data preprocessing or transformation.
- Ease of Use: Pandas provides a high-level interface that simplifies the creation and customization of boxplots. Users may create educational boxplots to see their data’s distribution with a few lines of code.
- Flexibility in Data Handling: Pandas offers robust data manipulation capabilities, enabling users to filter, aggregate, and transform data before creating boxplots. This flexibility empowers users to analyze specific subsets of their data or aggregate data across various groups or categories.
- Customization Options: The Pandas boxplot function provides several customization options for changing the look of the plot based on particular preferences. Users have the flexibility to customize aspects such as colors, labels, axes, and plot styles, allowing them to create visually appealing and informative boxplots.
- Integration with Matplotlib: Pandas uses the Matplotlib library for plotting, giving users access to a broad spectrum of additional plotting functionalities and customization options. This integration boosts the flexibility and versatility of Pandas boxplots, enabling users to design sophisticated and interactive visualizations.
- Compatibility with Statistical Analysis: The Pandas boxplot function is well-suited for statistical analysis because it automatically computes essential summary statistics such as the median, quartiles, and potential outliers. This feature simplifies users’ process of analyzing their data’s central tendency, spread, and variability using boxplots.
Getting Started with Pandas Boxplot
Pandas offers a simple approach for generating boxplots directly from DataFrame objects, facilitating the visualization of data distribution. The following steps will describe the basic procedures for utilizing Pandas boxplot:
1. Import Libraries: Before starting, ensure you have installed the necessary libraries.
import pandas as pd
import matplotlib.pyplot as plt
2. Create or Load Data: You can create a DataFrame with your data or load data from an external source, like a CSV file.
data = {'Category': ['A', 'A', 'B', 'B', 'C', 'C'],
'Value': [10, 20, 15, 25, 30, 35]}
df = pd.DataFrame(data)
3. Generate Boxplot: Once you prepared your DataFrame, you can generate a boxplot using the `boxplot()` function. By default, Pandas will create a boxplot for each numerical column in the DataFrame:
df.boxplot()
plt.title('Boxplot of Value by Category')
plt.ylabel('Value')
plt.xlabel('Category')
plt.show()
This code will display a boxplot of the ‘Value’ column grouped by the ‘Category’ column.
Output:

4. Customize Boxplot: Pandas Boxplot provides numerous customization options to improve the appearance and readability of the plot. You can customize elements such as colors, labels, axes, and plot styles:
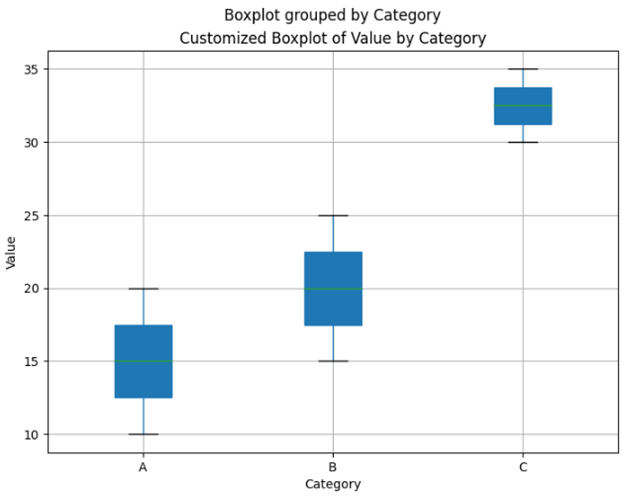
df.boxplot(column='Value', by='Category', patch_artist=True, figsize=(8, 6))
plt.title('Customized Boxplot of Value by Category')
plt.ylabel('Value')
plt.xlabel('Category')
plt.grid(True)
plt.show()
We customize the boxplot by specifying the column to plot (‘Value’), grouping by the ‘Category’ column, enabling patch_artist for colored boxes, and adjusting the figure size.
Output:
5. Additional Customization: You can customize the boxplot by adjusting additional parameters such as a notch, notchwidth, whisker width, medianprops, and more.
By following these steps, you can quickly generate and customize boxplots using Pandas, providing valuable insights into the distribution of your data. Experiment with different customization options to create informative and visually appealing boxplots for your data analysis needs.
Example for Pandas Boxplot
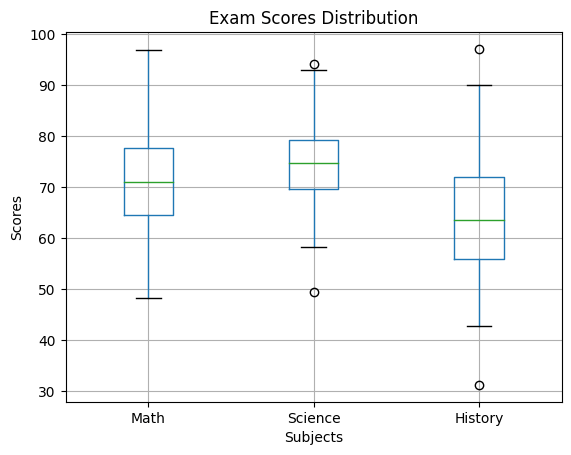
The following example utilizes the Pandas library to create a boxplot visualizing the distribution of exam scores across different subjects for a group of hypothetical students. The dataset contains scores for Math, Science, and History, each generated from a normal distribution to simulate variability in performance. The boxplot provides a visual summary of the distribution of scores within each subject, highlighting the median, quartiles, and potential outliers.
Code:
import pandas as pd
import numpy as np
import matplotlib.pyplot as plt
# Creating a DataFrame with exam scores of students in different subjects
data = pd.DataFrame({
'Math': np.random.normal(70, 10, 100),  # Mean score of 70 with standard deviation of 10
'Science': np.random.normal(75, 8, 100),  # Mean score of 75 with standard deviation of 8
'History': np.random.normal(65, 12, 100)  # Mean score of 65 with standard deviation of 12
})
# Creating a boxplot using pandas
data.boxplot()
# Adding labels and title
plt.xlabel('Subjects')
plt.ylabel('Scores')
plt.title('Exam Scores Distribution')
# Showing the plot
plt.show()
Output:
Explanation:
- The code imports necessary libraries: `pandas`, `numpy`, and `matplotlib.pyplot`.
- It creates a pandas DataFrame called `data` with three columns: ‘Math’, ‘Science’, and ‘History’.
- Each column contains 100 randomly generated values drawn from normal distributions representing exam scores.
- The mean and standard deviation for each subject’s scores are specified.
- The `boxplot()` function of pandas creates a boxplot of the data.
- Labels and a title are added to the plot for clarity.
- Finally, the plot is displayed using `plt.show()`.
Comparing Groups with Boxplot
Boxplots are valuable for visualizing the distribution of a single variable and comparing the distributions of multiple groups or categories within a dataset. In this section, we’ll delve into how to utilize boxplots for comparing groups.
Example:
This example illustrates how to create a boxplot with notches using the Pandas library in Python. Notches are employed to compare the medians of different groups visually. We’ll generate a dataset representing the stock prices of various companies and then create a boxplot with notches to compare the price distributions across companies.
Code:
1. We will create a dataset for the stock prices of different companies:
import pandas as pd
# Creating a DataFrame with stock prices of different companies
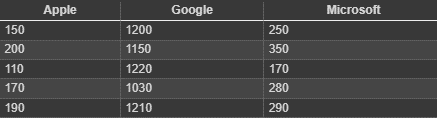
stock_data = pd.DataFrame({
'Apple': [150, 200, 110, 170, 190], # Hypothetical stock prices for Apple Inc.
'Google': [1200, 1150, 1220, 1030, 1210], # Hypothetical stock prices for Google
'Microsoft': [250, 350, 170, 280, 290] # Hypothetical stock prices for Microsoft
})
# Save the DataFrame to a CSV file
stock_data.to_csv('stock_data.csv', index=False)This code will create a table of the stock prices
Output:
2. Let’s create a boxplot for comparing the stock groups:
import matplotlib.pyplot as plt
stock_data = pd.read_csv('stock_data.csv')
# Create a grouped boxplot graph
stock_data.boxplot()
# Adding labels and title
plt.xlabel('Companies')
plt.ylabel('Stock Prices')
plt.title('Stock Prices Distribution')
# Showing the plot
plt.show()
Output:
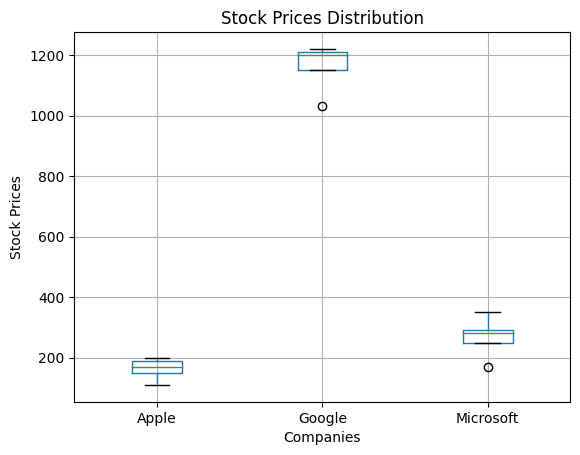
Explanation:
- DataFrame is created with hypothetical stock prices for Apple, Google, and Microsoft and saved to a CSV file.
- CSV file is read into a DataFrame to analyze the data.
- Then, it generates a grouped boxplot graph to visualize the distribution of stock prices for each company.
- For clarity, labels on the x-axis (‘Companies’) and y-axis (‘Stock Prices’) are included.
- The title ‘Stock Prices Distribution’ is set for the plot.
- Display the plot showing the distribution of stock prices across different companies.
Interpreting Boxplot
Understanding a boxplot requires grasping its key components and extracting meaningful insights about the data distribution. Here’s a step-by-step guide to interpreting a boxplot.
Let’s consider a hypothetical example where we have a dataset containing the ages of individuals in two different groups: Group A and Group B. We’ll create boxplots for each group and interpret the findings.
Code:
import pandas as pd
import matplotlib.pyplot as plt
# Sample data
data = {
'Building Type': ['Residential', 'Residential', 'Residential', 'Commercial', 'Commercial', 'Commercial'],
'Electricity Consumption (kWh)': [1790, 1050, 1500, 3500, 4400, 2600]
}
# Create DataFrame
df = pd.DataFrame(data)
# Generate boxplot for each building type
plt.figure(figsize=(8, 6))
df.boxplot(column='Electricity Consumption (kWh)', by='Building Type', patch_artist=True)
plt.title('Boxplot of Monthly Electricity Consumption by Building Type')
plt.xlabel('Building Type')
plt.ylabel('Electricity Consumption (kWh)')
plt.show()
Output:
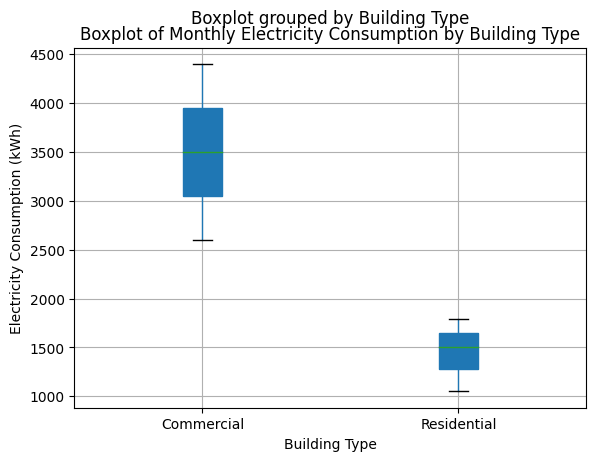
Let’s interpret the boxplot:
- Median: For Residential buildings, the median monthly electricity consumption is approximately 1500 kWh. Meanwhile, commercial buildings’ median monthly electricity consumption is around 3500 kWh.
- Quartiles (Upper and Lower): For Residential Buildings, The upper quartile is around 1270 kWh, and the Lower quartile is around 1645 kWh. For Commercial Buildings, The upper quartile is around 2600 kWh, and the lower quartile is around 3950 kWh.
- Interquartile Range (IQR): For Residential Buildings, IQR is approximately 375 kWh, whereas for commercial buildings, IQR is about 1350 kWh.
- Whiskers: The whiskers reach the lowest and highest values within 1.5 times the IQR of upper and lower quartiles.
- Box length and Skewness: The longer box for Commercial buildings than for Residential buildings suggests greater variability in monthly electricity consumption among Commercial buildings. Both distributions appear slightly right-skewed, as the median is closer to the upper than the lower.
- Central Tendency: The central tendency of monthly electricity consumption is higher for Commercial buildings than Residential buildings, with median values of approximately 1500 kWh and 3500 kWh, respectively.
Boxplot in Exploratory Data Analysis (EDA)
Boxplots play a crucial role in Exploratory Data Analysis (EDA) by providing a concise summary of the distribution of numerical variables. They help in identifying patterns, outliers, and anomalies within the data.
Role of boxplot in EDA process:
- Visualizing Data Distribution: Boxplots provide a visual summary of the central tendency, spread, and skewness of the data, allowing analysts to quickly grasp the distributional characteristics.
- Identifying Central Tendency: The position of the median line within the box gives an indication of the central tendency of the data.
- Assessing Spread: The length of the box and the extent of whiskers provide insights into the spread or variability of the data.
- Detecting Skewness and Outliers: The shape of the boxplot and the presence of outliers can indicate skewness or unusual data points that might require further investigation.
Detecting patterns and anomalies:
- Patterns: Boxplots help in identifying patterns such as symmetry, skewness, multimodality, and clustering of data points around specific values.
- Anomalies: Outliers, which are data points lying far from the bulk of the data, can be easily detected using boxplots. These outliers might represent errors, anomalies, or interesting phenomena in the data.
Example Code:
import pandas as pd
import matplotlib.pyplot as plt
# Example dataset
data = pd.DataFrame({
'A': [1, 2, 3, 4, 5, 6, 7, 8, 9, 10],
'B': [3, 4, 5, 6, 7, 8, 9, 10, 11, 12],
'C': [10, 15, 20, 25, 30, 35, 40, 45, 50, 55]
})
# Creating boxplots for each column
plt.figure(figsize=(10, 6))
data.boxplot()
plt.title('Boxplot of Variables A, B, and C')
plt.ylabel('Values')
plt.xlabel('Variables')
plt.show()
Output:
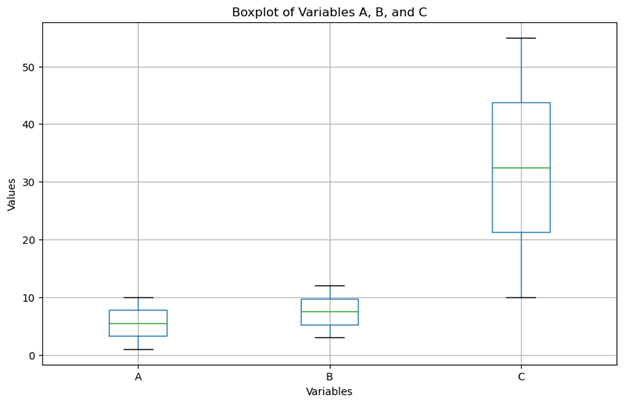
Explanation:
- In this example, we create a simple dataset with three numerical variables: A, B, and C.
- We then use Pandas’ .boxplot() function to generate a boxplot for each variable.
- By observing the boxplots, we can quickly identify the central tendency, spread, and presence of outliers in each variable, aiding in the exploratory analysis of the dataset.
Conclusion
Pandas boxplot is a powerful tool for visualizing data distribution, providing insights into central tendency, variability, and potential outliers. It seamlessly integrates with DataFrames, simplifying data handling and customization. With Pandas, users can quickly generate informative boxplots with minimal preprocessing. The boxplot function offers extensive customization options, including grouping data, adjusting labels and axes, and incorporating additional statistical parameters. Leveraging Pandas’ integration with Matplotlib, users can create sophisticated visualizations for practical data analysis and presentation. Boxplots facilitate comparison across groups, making them valuable for exploratory data analysis and statistical inference. Understanding boxplot components such as median, quartiles, and whiskers aids in interpreting data distribution and identifying patterns or anomalies. Overall, Pandas boxplot is a versatile and user-friendly tool for data visualization and analysis tasks in Python.
FAQs
Q1. What are some everyday use cases for Pandas boxplot?
Answer: Exploratory data analysis employs Pandas’ boxplot for statistical inference and showcases the distribution of numerical variables across diverse groups or categories. This approach proves advantageous in pattern recognition, outlier identification, and contrasting data distributions to glean insights into the underlying data structure.
Q2. Are there any limitations or considerations when using Pandas boxplot?
Answer: Although Pandas boxplot provides versatility and ease of use, users should be cautious of the assumptions associated with boxplot visualizations. Boxplots may not capture all facets of data distribution, and outliers or skewed data could impact interpretation. Moreover, users should consider the sample size and characteristics of the dataset when interpreting boxplot results.
Q3. Can I combine Pandas boxplot with other plots or visualizations?
Answer: Combination of Pandas boxplot with other plots or visualization is possible using Matplotlib, the underlying library for plotting in Pandas. Users can create multi-panel figures, overlay additional plots, or customize the appearance of boxplots to improve the visualization and analysis of their data.
Q4. How can I handle missing data when creating boxplots with Pandas?
Answer: Pandas offer functionality to manage missing data, such as NaN values, when creating boxplots. Users can use dropna() to eliminate rows or columns with missing values before generating the boxplot. Alternatively, they can fill in missing values using methods like fillna() with suitable strategies such as mean, median, or interpolation, ensuring data integrity before visualization.
Q5. How can I export Pandas boxplot visualizations to interactive HTML files for sharing or embedding in web applications?
Answer: Pandas provides functionality to export boxplot visualizations to interactive HTML files using libraries such as Plotly or Bokeh. Users can convert Pandas boxplot visualizations to interactive Plotly or Bokeh plots and then use plotly.offline.plot() or bokeh.plotting.output_file() to save the plots as standalone HTML files. This function allows for easy sharing or embedding in web applications, facilitating interactive data exploration.
Recommended Articles
We hope that this EDUCBA information on “Pandas boxplot” was beneficial to you. You can view EDUCBA’s recommended articles for more information.

