Updated March 4, 2023

Introduction to Multiple Plots in Matlab
Matlab plots are used for pictures of the data. We can use a plot statement when we show a comparison between the two quantities with each other, to visualize the data distribution, for showing tracks changes in the data. Matlab multiple plots are used to shows the data in different ways such as Line Plots, Discrete Data Plots, and many more. To create plots that have multiple rows or columns, we used a subplot statement. Subplot helps to display multiple axes in a Figure and used to divide the figure in a specific way. We can plot 2d and 3d plots in Matlab.
Syntax:
The syntax for Multiple plots in Matlab is as shown below:-
subplot(m, n, p)
subplot(m, n, p, 'replace')
subplot(m, n, p, 'align')
subplot(m, n, p, ax)
subplot('Position', pos)
subplot(___, Name, Value)
ax = subplot(___)
subplot(ax)
How to Do Multiple Plots in Matlab?
For multiple plotting of the data, we use plot and subplot statement.
The steps for multiple plotting of the data using subplot statement:-
- Step 1: We take variables and assign a value and plot 1st signal.
- Step 2: Then we use to hold on to plot the 2nd signal on the same axes but different colour or style.
The steps for multiple plotting of the data using subplot statement:-
- Step 1: Take the required signals.
- Step 2: Then we use a subplot statement with appropriate syntax
Examples of Multiple Plots in Matlab
Following are the Examples are given below:
Example #1
Le we see an example for multiple plots in matlab, in this example we take three signals on a single plot. Firstly we take a linspace function to generate a linearly spaced vector and this assign to x1 variable and we take a cos(x1) signal on y1 variable. Then we plot a signal by taking x1 and y1 variables, we plot signal using a plot function, plot the data in y1 versus the corresponding values in x1. Then we assign a title for that plot using a title function. Now, we use a hold on, hold on retains plot in current axes so that the new plot added without deleting a previous plot. Then we divide cos(x1) signal by 2 and assign those values to y2 and now we use plot function with x1 and y2 variables, this plot the 2nd signal on the same axes with a different color. And now we plot a 3rd plot take we multiply cos(x1) signal with magnitude 4 and those values assign to y3 variable. Then we use a scatter function to plot a 3rd signal, scatter plot with circles at the locations specified by the vectors x and y. Then lastly we take hold of function.
Code:
clc;

clear all;

close all;

x1 = linspace(0,20,60);y1 = cos(x1);plot(x1,y1)title('Combine Plots')hold ony2 = cos(x1/2);plot(x1,y2)y3 = 4*cos(x1);scatter(x1,y3) hold off
Output:

Example #2
Let us see an example, we create 4 subplots for any random values and then we replace the 4th subplot with empty axes. For this, we take a for loop with value k=4 and in that for loop we use a rand function, basically rand function is used to generate a random number it this example we take 20 random numbers, so we take rand(1,20) and these 20 random numbers are assigned to the variable d. Then we use a subplot function, we use subplot (2, 2, k) divides the current figure into a 2-by-2 grid and creates axes in the position specified by k. Then the values of k is varied from 1 to 4. Then we use a steam function with that 20 random numbers then we end the loop. After that we replace the 4th plot with an empty plot, for this, we use a ‘subplot (2, 2, 4, ‘replace’)’ this statement.
Code:
clc;

clear all;

close all;

for k = 1:4

d = rand(1,20);

subplot(2,2,k)

stem(d)end

subplot(2, 2, 4, 'replace')
Output:
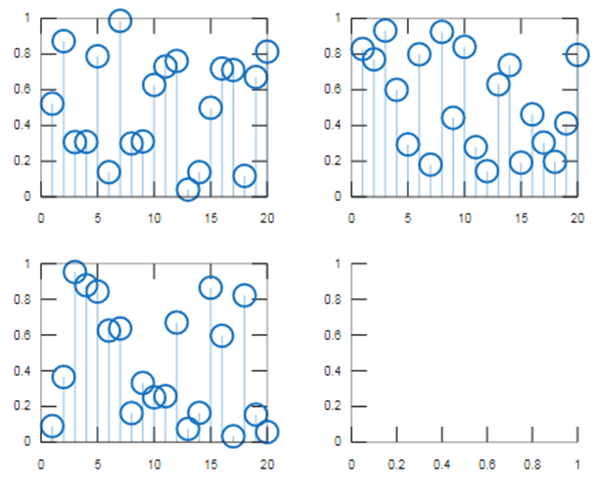
As we saw a figure, the 4th plot is replace with empty plot.
Example #3
Let see an example for multiple plots in Matlab, we use a subplot function to plot 4 different plots for this we take subplot (2, 2, p)divides the current figure into a 2-by-2 grid, and creates axes in the position specified by p, the value of p decides the how many plots we plot. In our example, we take the value of p is 4. First, we specify the x1 variable using the linspace function to 0 to 20. Then we take y1 variable as cos(x1), then we use a plot function to plot a signal using x1 and y1 variables. Then we assign a title to that plot using title function and the same produce repeats three times to plot 3 subplots. We can multiple cos(x1) with 2, 3 and 4 for y2, y3, and y4 respectively. And assign different titles for different plots and we also change a value of p in a subplot. Then we see 4 plots with the different signal in one figure.
Code:
close all;

subplot(2,2,1)

x1 = linspace(0,20);

y1 = cos(x1);

plot(x1,y1)

title('Subplot 1: cos(x1)')

subplot(2,2,2)

y2 = cos (2*x1);

plot(x1,y2)

title('Subplot 2: cos (2x1)')

subplot(2,2,3)

y3 = cos (3*x1);

plot(x1,y3)

title('Subplot 3: cos (3x1)')

subplot(2,2,4)

y4 = cos(4*x1);

plot(x1,y4)

title('Subplot 4: cos(4x1)')
Output:

Conclusion
In this article, we saw the concept of multiple plots in Matlab basically multiple plots are used to visualize of the data. Then saw syntax related to multiple plots and how it is used in Matlab code. Also, we saw some examples related to multiple plots and their output on Matlab.
Recommended Articles
This is a guide to Multiple Plots in Matlab. Here we also discuss the introduction and how to do multiple plots in Matlab along with different examples and its code implementation. You may also have a look at the following articles to learn more –
