Updated March 3, 2023

Introduction to Matlab plot title
In MATLAB, the ‘title’ command is used to add a title to any plot or a visual. We can add a single title or a title with a subtitle to a plot. The formatting of the title can be controlled by using pre-defined name-value pairs present in MATLAB. These name-value pairs are passed as arguments to the ‘title’ command to control the formatting of the plot title.
This title helps us in identifying what the plot is about or what it tries to convey.
Syntax:
- title(text) will add the title specified as ‘text’ to the plot. Please note that, if the plot already has a title, then using this command will replace the existing title
- title(text 1, text 2) is used if we need a title and a subtitle. The first argument ‘text 1’ will come as the main title and the second argument ‘text 2’ will come as the subtitle and this will be displayed below the main title
- title(text ,Name, Value) is used to control the format of the title by using the name value pair argument
Examples of Matlab plot title
Let us now understand how to give a title to a plot in MATLAB with the help of different examples
Example #1
In the first example, we will plot a sine wave in MATLAB and will give it the title “Sine Wave”. The steps to be followed for this example are:
- Initialize the x-axis
- Initialize the y-axis
- Use the ‘plot’ command the plot the sine wave
- Use the ‘title’ command to give title to this plot
Code:
x = linspace(0, 3*pi, 50);
[Initializing the x axis]
y = sin(x);
[Initializing the y axis]
plot(x, y)
[Code to plot the sine wave]
title(‘Sine Wave’)
[Giving title to the plot created in above step]
This is how our input and output will look like in Matlab command window:
Input:
x = linspace(0, 3*pi, 50);

y = sin(x);

plot(x, y)

title('Sine Wave')
Output:
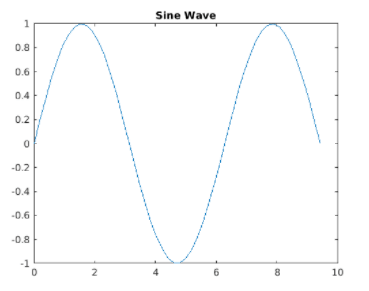
As we can see in the Output, we have obtained a plot of a sine wave with the required title. Next, we will learn how to give a title and a sub-title to the plot.
Example # 2
For this example, we will plot a cos wave in MATLAB and will give it the title “Trigonometric Wave” and sub-title “Cos Wave”. The steps to be followed for this example are:
- Initialize the x-axis
- Initialize the x-axis
- Use the ‘plot’ command the plot the cos wave
- Use the ‘title’ command with 2 text arguments to give a title and a subtitle to this plot
Code:
x = linspace(0, 3*pi, 50);
[Initializing the x axis]
y = cos(x);
[Initializing the y axis]
plot(x, y)
[Code to plot the cos wave]
title(‘Trigonometric Wave’, ‘Cos Wave’)
[Giving title and sub-title to the plot created in above step]
This is how our input and output will look like in MATLAB command window:
Input:
x = linspace(0, 3*pi, 50);

y = cos(x);

plot(x, y)

title('Trigonometric Wave', 'Cos Wave')
Output:
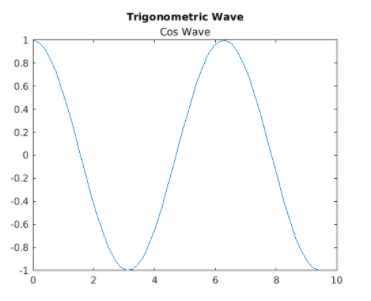
As we can see in the OUTPUT, we have obtained a plot of a cos wave with the required title and a sub-title.
Example #3
For this example, we will plot a sine wave and a cos wave in the same graph and will give it the title “Trigonometric Wave” and sub-title “Sine & Cos wave”. The steps to be followed for this example are:
- Initialize the x-axis
- Initialize the y-axis
- Use the ‘plot’ command the plot the sine and cos waves
- Use the ‘title’ command with 2 text arguments to give a title and a sub-title to this plot
Code:
x = linspace(0, 3*pi, 50);
[Initializing the x axis]
y = sin(x);
[Initializing the sine wave]
plot(x,y)
[Code to plot the sine wave]
hold on

y1 = cos(x);
[Initializing the cos wave]
plot(x, y1)
[Code to plot the cos wave]
hold off

title('Trigonometric waves', 'Sine & Cos wave')
[Giving title and sub-title to the plot created in above step]
This is how our input and output will look like in MATLAB command window:
Input:
x = linspace(0, 3*pi, 50);

y = sin(x);

plot(x,y)

hold on

y1 = cos(x);

plot(x, y1)

hold off

title('Trigonometric waves', 'Sine & Cos wave')
Output:
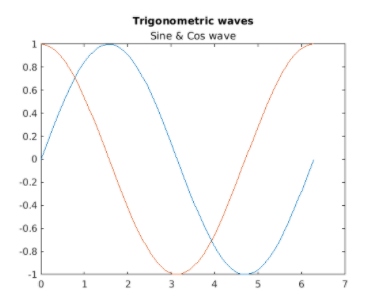
As we can see in the Output, we have obtained a plot of a sine and cos wave with the required title and a sub-title. Next, we will learn how to format the title of the plot.
Example #4
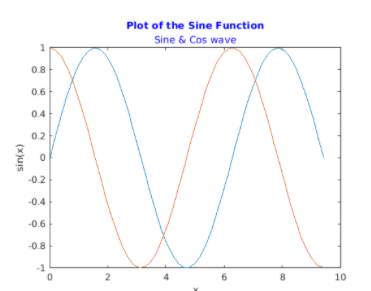
For this example, we will plot a sine wave and a cos wave in the same graph as in the above example but will give the title and sub-title in ‘Blue’ color. The steps to be followed for this example are:
- Initialize the x-axis
- Initialize the y-axis
- Use the ‘plot’ command the plot the sine and cos waves
- Use the ‘title’ command with 2 text arguments and an additional name-value pair argument to specify the blue color
Code:
x = linspace(0, 3*pi, 50);
[Initializing the x axis]
y = sin(x);
[Initializing the sine wave]
plot(x,y)
[Code to plot the sine wave]
hold on

y1 = cos(x);
[Initializing the cos wave]
plot(x, y1)
[Code to plot the cos wave]
hold off

title('Trigonometric waves', 'Sine & Cos wave', 'Color', 'blue')
[Giving an extra argument to get the title and sub-title in ‘Blue’ color]
This is how our input and output will look like in MATLAB command window:
Input:
x = linspace(0, 3*pi, 50);

y = sin(x);

plot(x,y)

hold on

y1 = cos(x);

plot(x, y1)

hold off

title('Trigonometric waves', 'Sine & Cos wave', 'Color', 'blue')
Output:
As we can see in the Output, we have obtained a trplot of a sine and cos wave with the required title in blue color.
Conclusion
The ‘title’ command is used in MATLAB to add a title to any plot or a visual. We can add a single title or a title with a subtitle to a plot. The format of title can be controlled using various name-value pairs.
Recommended Articles
This is a guide to Matlab plot title. Here we discuss the introduction to Matlab plot title, syntax, commands and Examples along with code implementation respectively. You may also have a look at the following articles to learn more –
