Updated May 23, 2023

Introduction of Convolution Matlab
A mathematical way of combining two signals to form a new signal is known as Convolution. In Matlab, for Convolution, the ‘conv’ statement is used. The Convolution of two vectors, p, and q given as “a = conv( p,q ),” which represents the area of overlap under the points as p slides across q. Convolution is the most important technique in Digital Signal Processing. Calculating the Convolution directly can be difficult, so we use Fourier transforms and multiplication methods to calculate it easily. We use Convolution in various fields such as differential equations, statistics, image and signal processing, probability, language processing, etc.
Syntax:
The syntax for Convolution Matlabisas is shown below:-
w = conv(u,v)
w = conv(u,v,shape)
How to Do Convolution Matlab?
For performing a convolution operation on Matlab, we follow the following steps:-
- Step 1: Take an input signal and also define its length
- Step 2: Take an impulse response signal and define its length
- Step 3: Perform a convolution using a conv function on Matlab
- Step 4: If we want to plot three signals, we use a subplot and stem functions.
Examples of Convolution Matlab
Following are the examples are given below:
Example #1
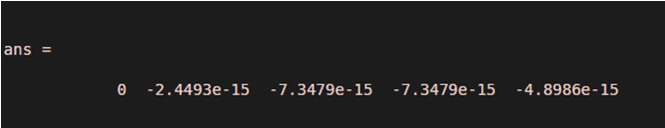
This example is about how to calculate the result of the convolution of two different signals in a matlab. For generating time duration, we are taking it as 0 to 2 with a difference of 1, and this time duration we take in a t1 variable. Now we generate a frequency of the first signal as a 10 hertz this assign to fr1, and we generate a frequency of the second signal as a 15 hertz this assign to fr2. Now generate a 1st signal as y1 equals to sin of 2 * pi * fr1.* t1, where fr1 is 1st signal frequency and t1 is a time duration. Then we generate a 2nd signal as y2 equals to cos of 2 * pi * fr2.* t1, where fr2 is 2nd signal frequency and t1 is a time duration. Now we convolve both the signals y1 and y2 and we are going to save the result in variable Y convolution can be performed in the matlab using a command conv, convis a abbreviation of convolution that is the 1st 4 words of convolution conv of now place 1st signal name y1 and comma for separated place 2nd signal name y2. We put a clc at a beginning of the code to just clear the command window after running this code.
Code:
clc;

clear all;

close all;

t1 = 0 : 1 : 2;

fr1 = 10;

fr2 = 15;

y1 = sin (2 * pi * fr1 .* t1);

y2 = cos (2 * pi * fr2 .* t1);

conv (y1, y2)
Output:
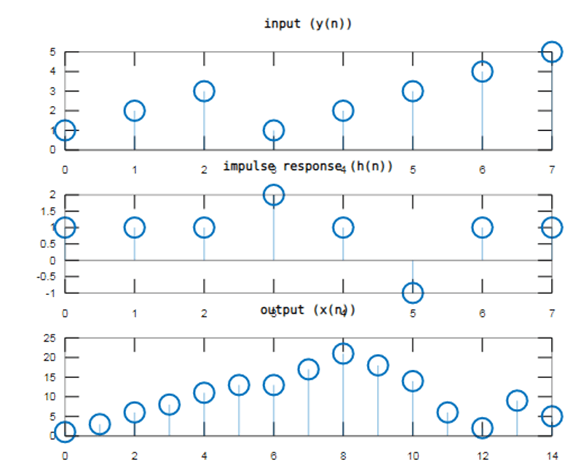
Example #2
In this example, we perform the sum of the two signals; firstly, we define an n1 variable as 0 to 7 with a difference of 1. Now we take the first signal in the y1 variable as 1 2 3 1 2 3 4 5. These numbers are taken in the square bracket, and then we take h1, h1 is an impulse response. We take h1 equals to in square brackets 1 1 1 2 1 -1 1 1. Now convolution can be performed in MATLAB using the command conv; conv is an abbreviation of convolution that is the 1st 4 words of convolution conv of now place 1st signal name y1 and comma for separated place 2nd signal name h1. And the convolution result we stored in the X variable. For plotting three signals, we 1st plot Figure 1 in the signal figure we plot three signals using a subplot function. subplot(3,1,1), so 1st we plot a y1 w.r.t n1; to plot a signal, we use the stem function, stem is used to plot a discrete-time signal, so we take stem(n1, y1). Subplot(3,1,2), so 2nd we plot an h1 w.r.t n1, so plotting a signal we use stem function take stem(n1, h1). Subplot (3,1,3), so 3rd, we plot an X w.r.t n1, so plotting a signal, we use stem function take stem (n2, X). Here n2 is the length of convolution signal minus 1 because we start with a 0.
Code:
clc;

clear all;

close all;

n1 = 0 : 1 : 7;

y1 = [ 1 2 3 1 2 3 4 5 ];

h1 = [ 1 1 1 2 1 -1 1 1 ];

X = conv (y1, h1);

n2 = 0 : length(X)-1;

figure(1)

subplot(3,1,1)

stem(n1, y1)

title('input (y(n))')

subplot(3,1,2)

stem(n1, h1)

title('impulse response (h(n))');

subplot(3,1,3)

stem(n2, X)

title('output (x(n))');
Output:
Example #3
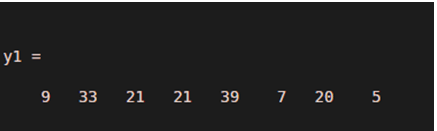
Let us see an example for convolution; 1st, we take an x1 is equal to the 5 2 3 4 1 6 2 1. It is an input signal. Then we take impulse response in h1, h1 equals to 2 4 -1 3, then we perform a convolution using a conv function, we take conv(x1, h1, ‘same’), it performs convolution of x1 and h1 signal and stored it in the y1 and y1 has a length of 7 because we use a shape as a same. The full convolution would be of length, length(x1)+length(h1)-1, which in this example would be 11.
Code:
clc;

clear all;

close all;

x1 = [5 2 3 4 1 6 2 1];h1 = [2 4 -1 3];y1 = conv(x1, h1,'same')
Output:
Recommended Articles
We hope that this EDUCBA information on “Convolution Matlab” was beneficial to you. You can view EDUCBA’s recommended articles for more information.
