Updated March 4, 2023

Introduction to Matlab limit
The limit() function is used to impose limit on the minimum and maximum value for a symbolic expression in order to maintain them within a defined specific range. The limits can also be applied to any Matlab plot using the commands xlim, ylim and zlim. The limits are useful for various data analysis and behavior at different ranges of data value.
Syntax of Matlab limit
Given below are the syntax of Matlab limit:
| Syntax | Description |
| limit(f,var,a) | limit(f,var,a) form of the function is used to return the symbolic expression f with imposition of the Bidirectional Limit when var tends to a. |
| limit(f,a) | limit(f,a) form of the function is used to return the symbolic expression f with imposition of the Bidirectional Limit when the default variable that is found by symvar, tends to reach the value, a. |
| limit(f) | limit(f) form of the function is used to return the symbolic expression f having the values being limited to value, 0. |
| limit(f,var,a,’left’) | limit(f,var,a,’left’) form of the function is used to return the symbolic expression f having the values being limited to value by the Left Side Limits for ‘f’ as var tends to reach the value a. |
| limit(f,var,a,’right’) | limit(f,var,a,’right’) form of the function is used to return the symbolic expression f having the values being limited to value by the right Side Limits for ‘f’ as var tends to reach the value a. |
Input Arguments
Given below are the input arguments:
- Input (f): The input to the function is denoted as f. It can be specified as a function, symbolic expression, matrix or vector.
- Independent variable (var): Independent variable is a symbolic variable, denoted as ‘var’. When var is not defined explicitely, then ‘symvar’ determines a default variable as the independent variable.
- Limit point (a): The limit values for the input ‘f’ can be specified in terms of a number or a symbolic number, variable, or expression.
Example #1
Code:
syms var delta

func = cos(var)/var; //function1 expression as input

limit(func,var,0)// limit of var tends to 0

func = (cos(var+delta)-cos(var))/delta; //function2 expression as input

limit(func,delta,0)//limit of delta tends to 0
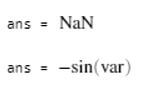
Output:
- Output 1: The threshold value for the function func where var=0.
- Output 2: The threshold value for the function func where delta=0.
Considering a sin function.
Example #2
Code:
syms var delta

func = sin(var)/var; // sin(var)/var is input to the function

limit(func,var,0) // evaluating function func where var tends to 0

f = (sin(var+delta)-sin(var))/delta; //(sin(var+delta)-sin(var))/delta is input

//to the function

limit(func,delta,0) //evaluating function where delta tends to 0
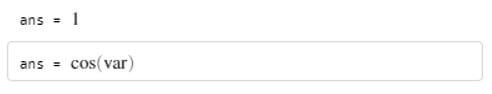
Output:
Considering a cos function.
- Output 1: The threshold value for the function func where var=0.
- Output 2: The threshold value for the function func where delta=0.
Example #3
Code:
syms var

func = 1/(2*var); //Input to right side limit function

limit(func,var,0,'right') //Executing right side limit function on the input

//function func
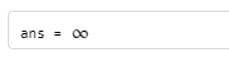
Output:
The output is the result of the value for the function func where value of the var is near to 0 being a positive value.
Example #4
Code:
syms var

func = 1/(2*var); //Function as input for left side limit function

limit(func,var,0,'left') //Executing left side function on input function
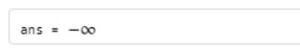
Output:
The output is the result of the value for the function func where value of the var is approximate to 0 being a negative value.
limit of Expressions in Symbolic Vector
limit function in Matlab also supports to be imposed with symbolic vector. In that case the function acts on the vector element-wise.
Example
Code:
syms var delta

Vector = [(1+delta/var)^var exp(-var)]; //The vector on which the limit is

//imposed

limit(Vector,var,Inf) //Executing limit function on the vector
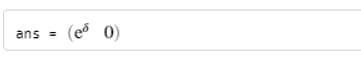
Output:
The output in the form of 2X1 vector is produced as value of var as inf for each element of 2X1 vector ‘Vector’.
Specify Axis limits
The range of data points on any Matlab plot can be controlled and coordinates of data to be appeared in the x-axis, y-axis, and z-axis having limits imposed on the respective axes using xlim, ylim and zlim respectively. The appearance of lines along x-axis and y-axis in case of only 2-D plots can be altered or reversed with respect to the direction in which the values are presented in increasing order along each axis.
Example #1
Code:
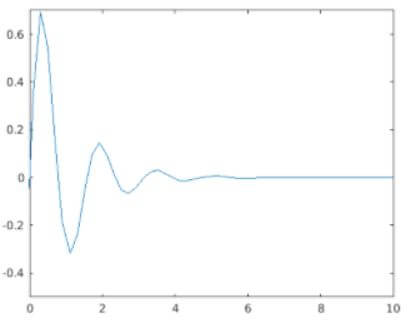
xdata = linspace(-15,15,150); //Defining data points along x-axis

ydata = sin(4*xdata)./exp(xdata); //Defining data points along y-axis

plot(xdata,ydata) //Creating the 2 dimensional plot

xlim([0 10]) //Imposing limits on data points along x-axis

ylim([-0.5 0.7]) //Imposing limits on data points along y-axis
Output:
Example #2
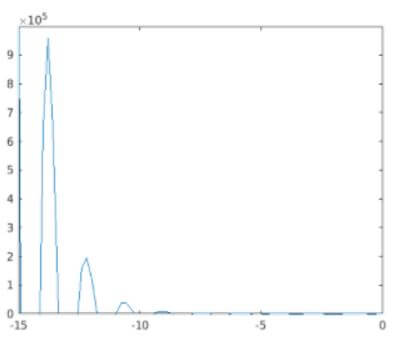
The limits for 2 dimensional plot can either be decided by the program explicitly or by the Matlab to pick any default value depending on the function and acceptable values across the axes.
In the below example, the maximum limit on x-axis is set to 0 and the minimum value on y-axis is set to -1. Limit values for the other edges are left to be chosen by Matlab. In order to incorporate an automatic calculation process to decide on minimum and maximum limit, the values -inf or inf are used respectively.
Code:
xdata = linspace(-15,15,150); //Defining data points across x-axis

ydata = sin(4*xdata)./exp(xdata);//Defining function across y-axis

plot(xdata,ydata) //Creating the 2 dimensional plot

xlim([-inf 0])  //Imposing partial limit on x-axis data points having upper value

//limit fixed to 0

ylim([-1 inf]) //Imposing partial limit on y-axis data points having lower value

//limit fixed to -1
Output:
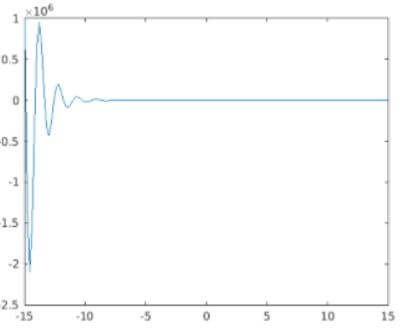
As per the requirement of the algorithm or user, the limits can be reverted back to default values in the 2 dimensional plot using xlim, ylim or zlim followed by keyword ‘auto’.
Code:
xdata = linspace(-15,15,150); // Defining the data points across x-axis

ydata = sin(4*xdata)./exp(xdata); //Defining the function for y-axis

plot(xdata,ydata) //Creating the 2 dimensional plot

xlim([-inf 0]) //Imposition of limits on x-axis values

ylim([-1 inf]) //Imposition of limits on y-axis values

xlim auto //Reverting limits on x-axis data points to default value

ylim auto //Reverting limits on y-axis data points to default value
Output:
Additional Note:
There are 3 scenarios of applying limits by the limit() function in Matlab such as:
1. This is applied to include bidirectional limits:
![]()
2. This is applied to include left side limits:
![]()
3. This is applied to include right side limits:
![]()
Recommended Articles
This is a guide to Matlab limit. Here we discuss the introduction, limit of expressions in symbolic vector and specify axis limits. You may also have a look at the following articles to learn more –
