Updated March 3, 2023
Introduction to Matlab fplot()
MATLAB function fplot() is used to generate symbolic plots with respect to expressions or functions. The default range of interval for the graph generated out of the fplot() function is [-5,5].
Example
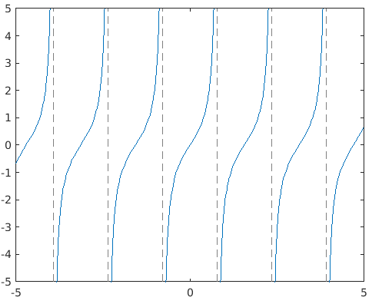
The below code is designed to generate a plot for the function tan(2x) using the fplot() method.
symsvar

fplot(tan(2*var))
Output: The plot is generated for the function tan(2*var) with respect to the values of var ranging from -5 to 5.
Syntax
Based on the input argument given in the function call, there is the various syntax which can be used to implement the fplot() method as described below:
| Syntax | Attribute Description |
| fplot(f) | f is the function or expression for which the plot is to be generated |
| fplot(f,xinterval)/fplot(f,[xminxmax]) | Xmin- initial limit of the interval from which the plotting f(x) should be initiated
Xmax- final limit of the interval at which the plotting f(x) should be completed |
| fplot(pt,qt) | ptand qt are two different function of common variable t i.e. pt=p(t) and qt=q(t) |
| fplot(pt,qt,tinterval)/fplot(pt,qt,[tmintmax]) | tmin- initial limit of the interval from which the plotting p(t) and q(t) should be initiated
tmax- final limit of the interval at which the plotting p(t) and q(t) should be completed. |
| fplot(___,LineSpec) | Linespec is used to customize the plot presentation by customizing set the line color, marker symbol, and line styleetc. |
| fplot(___,Name,Value) | Used to set property ‘Name’ with the value ‘Value’ for the plot |
| fplot(ax,___) | Used to create plot with the newly defined axes ax, instead of default ones |
| p = fplot(___) | The output from the fplot() function call is stored in parameterized line object |
Methods of Matlab fplot()
Let’s understand the application of various syntax for implementing the method fplot() by means of examples.
Method #1 – Using the syntax fplot(x)
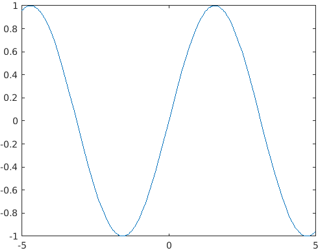
In the below example there is only one input argument i.e. the expression function defined with the depending variable x. Here, the value range for the variable x is set to default values i.e. [-5,5].
syms func(x)

func(x) = sin(x);

fplot(func)
Output:
Method #2 – Using the syntax fplot(f,finterval)
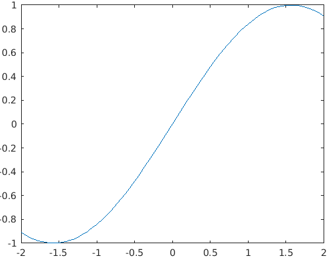
The below code is written to generate a pot for the given expression func(x) within the specified time interval i.e. finterval.
Code:
syms func(x)

func(x) = sin(x);

fplot(func,[-2,2])
Output: The resultant plot is generated for the expression of sin(x) for the defined range of values -2 to 2.
Method #3 – Using the syntax fplot(pt,qt)
The below MATLAB code is designed to generate plots for two functions pt, qt with the common depending variable t with the single call of the method fplot().
Code: The value range for the depending variable t is the default value set i.e. [-5,5].
pt = @(t) tan(2*t);

qt = @(t) cot(3*t);

fplot(pt,qt)
Output:
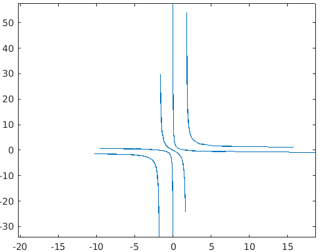
Method #4 – Using the syntax fplot(pt,qt,tinterval)
Code:
pt = @(t) tan(2*t);

qt = @(t) cot(3*t);

fplot(pt,qt,[-1,1])
Output: The resultant graph generated from the above code, contains the plots for the expressions tan(2t) and cot(3t) for the depending variable t within the specified time range of [-1,1].
5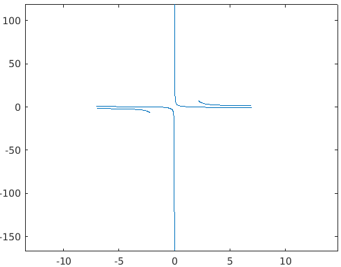
Method #4 – Using the syntax p=fplot(——)
The below code is written to demonstrate the behavior of the function fplot() with a parametric object.
First phase
Code: The plot is generated using function call fplot() and is assigned to the parametric variable ‘p’.
syms var

p = fplot(cos(var))
Output:

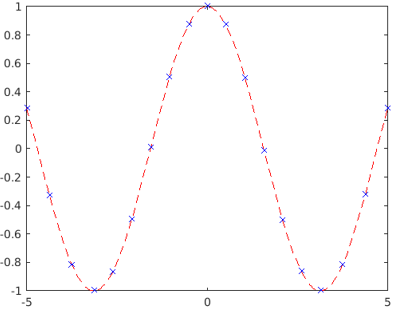
Second Phase
Code: The presentation of the plot is customized by editing the attribute values accessing through the parametric object ‘p’.
p.LineStyle = '--';

p.Color = 'r';

p.Marker = 'x';

p.MarkerEdgeColor = 'b';
Output:
Example
The below code is written to generate the plot for the given function expression with editing representation of the graph by including title, x,y labels and tick values.
Code:
syms var

fplot(cos(var),[-2*pi 2*pi])

grid on

title('sin(var) from -2\pi to 2\pi')

xlabel('var')

ylabel('f')

nx = gca;

S = sym(nx.XLim(1):pi/2:nx.XLim(2));

nx.XTick = double(S);

nx.XTickLabel = arrayfun(@texlabel,S,'UniformOutput',false);
Output:
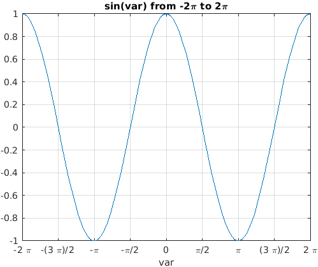
The plot is generated for the expression sin(var) for the range of values of var, -2\pi to 2\pi.The title of the graph as ‘sin(var) from -2\pi to 2\pi’, xlabel as ‘var’ and ylable as ‘f’ is set.
Different Attributes Supported by fplot()
There are various attributes that are supported by fplot() to edit the display of the plot. The major attributes are described in the below table:
| Attribute | Description |
| LineSpec | Used to customize the display of the plot lines, markers, etc. |
| Color | Used to decide the color of the line |
| LineStyle | Used to decide the style of the line |
| Marker | Decides the symbol be used as a marker |
| MarkerEdgeColor | Used to decide the outline color of the marker |
| MarkerFaceColor | Used to set the color to be filled in the marker |
| MarkerSize | Decides the size of the marker |
| MeshDensity | To set the number of the evaluation point |
Examples to Implement Matlab fplot()
Below are the examples mentioned:
Example #1
The below code snippet is designed to plot the functions ‘pt’ and ‘qt’ and regulating the attribute Linewidth.
Code:
pt = @(t) tan(2*t);

qt = @(t) cot(3*t);

fplot(pt,qt,'-.*c','Linewidth',2)
Output:
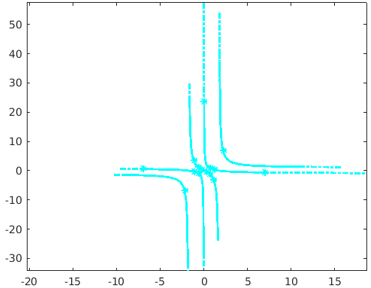
The resultant plot generated from the method fplot() for the functions pt and qt is presented with a modified line width value 2.
Example #2
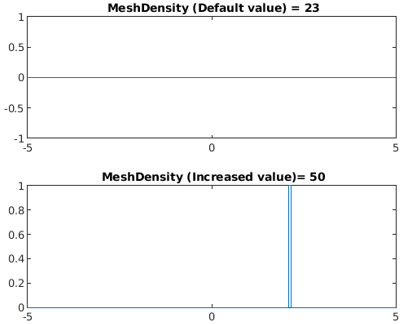
The smoothness, accuracy, and speed of the drawing of the plot are controlled by the option MeshDensity which is the count for evaluation points.
Code:
syms x

Funcstep = rectangularPulse(2.1, 2.15, x);

subplot(2,1,1)

fplot(Funcstep);

title(' MeshDensity (Default value) = 23')

subplot(2,1,2)

fplot(Funcstep,'MeshDensity',50);

title(' MeshDensity (Increased value)= 50')
Output:
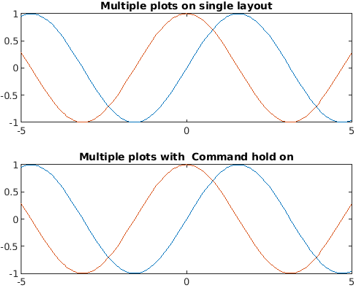
The method fplot() also supports plotting multiple functions in one single frame by splitting the layout into the same number of cells.
Example #3
Code:
syms var

subplot(2,1,1)

fplot([sin(var) cos(var)])

title('Multiple plots on single layout')

subplot(2,1,2)

fplot(sin(var))

hold on

fplot(cos(var))

title('Multiple plots with  Command hold on')

hold off
Output:
Additional Note
Below are the additional note for Matlab fplot():
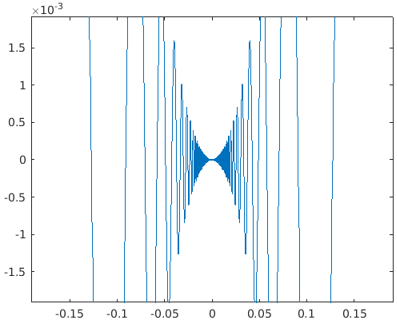
1. Re-evaluation on Zoom: The plot generated from the fplot can be reevaluated by using the zooming feature. It helps the user to reveal the hidden details in the plot.
Code:
syms var

fplot(var^2*cos(1/var));

axis([-2 2 -0.02 0.02]);

for i=1:5

zoom(1.6)

pause(0.6)

end
Output:
2. In casefplot(f) syntax or any of its variation is used, then returned object is of type FunctionLine objects whereas in case of fplot(funx,funy) syntax,the object return type is ParameterizedFunctionLine.
Thus the function fplot() in MATLAB supports advanced plotting features for any kind of function or expressions along with providing a wide range of customization flexibility.
Recommended Articles
This is a guide to Matlab fplot(). Here we discuss the methods to know, with examples to implement with additional notes in detail. You can also go through our other related articles to learn more –
