Updated May 31, 2023

Introduction to Matlab Comet()
Comet is a function used to plot a graph in Matlab. Matlab plot function is also used to plot the graph but comet gives more efficient visualization as compared to the plot function. It is an animated graphical view of the input function. It contains two parameters head and tail. Head is a small circle which represents the start of graph and tail is a single line that traces the whole function. Comet function needs input parameters to operate the specific problem, where we can add various input options that are required in the graph. Comet function mostly used when input is also one of the functions which require some input from users.
How does Comet() Works in Matlab?
There are various ways to write comet functions such as comet with a single parameter, a comet with two parameters, comet with three parameters including condition and comet with multiple parameters.
Steps to Use Comet() Function:
- Accept the input parameters
- Apply comet function (comet())
- Display the output
Methods to Use Comet() Function in Matlab
Following are the methods to use Comet() function in detail.
1. Comet (50)
Syntax:
comet (single parameter)
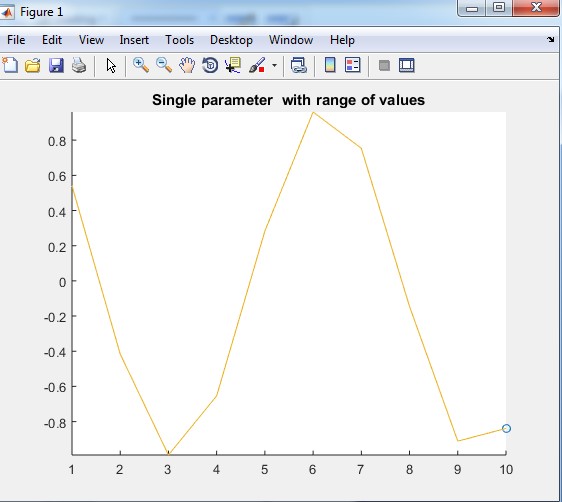
Explanation: In the above example, there is only one parameter. Here we directly use-value of the parameter inside the brackets. otherwise, we can also declare any variable and then assign value 50 to the variable output of this example is only circle at value there will be two tracing of the tail. In table 1.2 first, we declare one variable ‘ip1’ then assign value to the variable ip1.output for this example is an only head position that is a circle, there will be no tracing of function. Table 1.3 shows the Matlab code for a range of values, in this input is ip1 which has values of 1 to 9, Output for this example is tracing of the tail from number one to number 9. And in table 1.4 input is cos function. In this example first, we declare the values of angles which are 1 to 10 and then we apply cos function on values 1 to 10 and then we apply comet function on cos. The output of this example is the tracing of cos function from value cos (1) to cos (10).
Table 1.1:
| Matlab Editor | Command Window |
| comet(50) title (‘ single parameter with direct value ‘) |
– – |
Following is the Output of table 1.1 single parameter with a direct value.
Output:
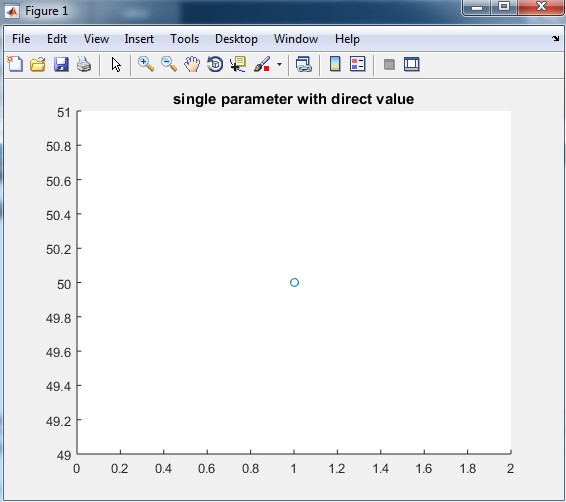
Table 1.2:
| Matlab Editor | Command Window |
| x = 20 comet(x)title(‘single parameter with variable’) |
>> Untitled x = 20 |
The output of table 1.2 is as follows:
Output:
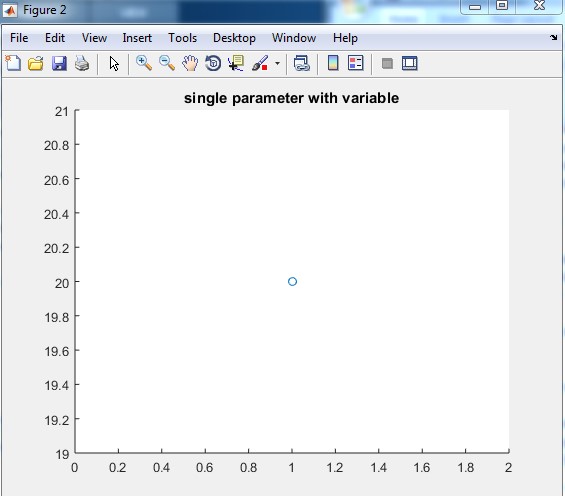
Table 1.3:
| Matlab Editor | Command Window |
| ip1=1:9 comet(ip1) title(‘single parameter with range of values’) |
>> Untitled ip1 = 1 2 3 4 5 6 7 8 9 |
The output of table 1.3 is:
Output:
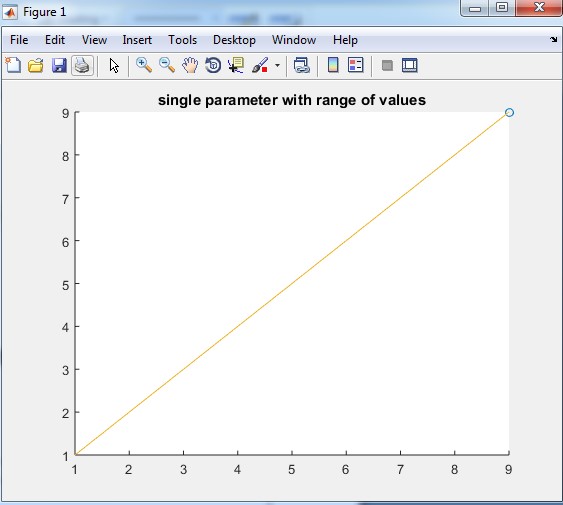
Table 1.4:
| Matlab Editor | Command Window |
| angle=1:10 ip1=cos(angle)’ comet(ip1) title(‘Single parameter with range of values’) |
>> Untitled angle = 12345678910 ip1 = 0.5403 -0.4161 -0.9900 -0.6536 0.2837 0.9602 0.7539 -0.1455 -0.9111 -0.8391 |
The output of table 1.4 Cos function with a range of values.
Output:
2. Comet (40,30)
Syntax:
comet (first parameter, second parameter)
Comet functions mostly used in this format only. In this type, there will be two parameters inside the comet bracket. These two parameters are the input of the function. In the first example table 2.1, we directly give the values to the function which are 40 and 30. The output of table 2.1 is only a head position that is a circle there is no tracing of function. In the second table 2.2 first, we declare the two variable ip1 and ip2 then we assign the values to the variables that means ip1 is 40 and ip2 is 30. The output of this example is only head position (ip1 with respect to ip2) which is a circle there is no tracing of function.
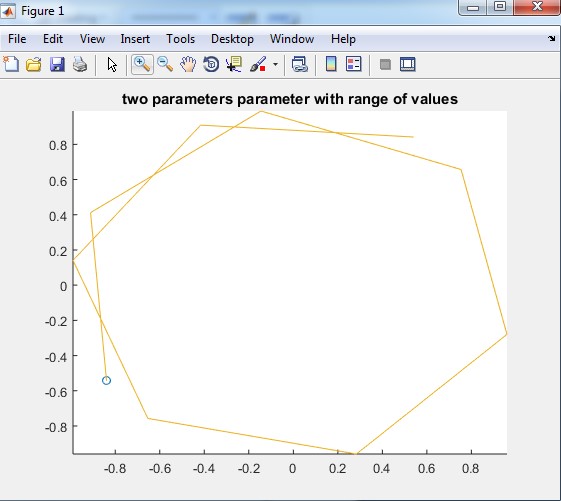
In table 2.3 input parameters are again function. Two functions cos and sin are used as input to the comet but cos and sin also require own input so input is given a range of values which is represented as an angle in this example. So the output graph is a trace of cos function with respect to trace of sin function.
Table 2.1:
| Matlab Editor | Command Window |
| comet (40 , 30 ) title ( ‘Two parameters with direct value’ ) |
n – |
The output of table 2.1:
Output:
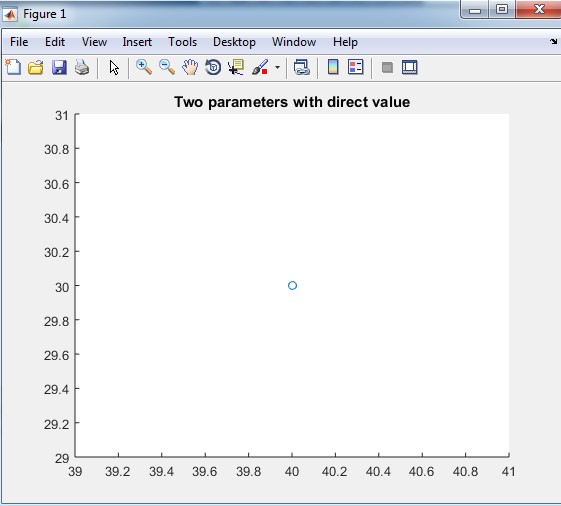
Table 2.2:
| Matlab Editor | Command Window |
| ip1 = 40 ip2 = 30 comet(ip1 , ip2) title(‘Two parameters with variables’) |
>> Untitled ip1 = 40 ip2 = 30 |
Output of table 2.2 two parameters with variables.
Output:
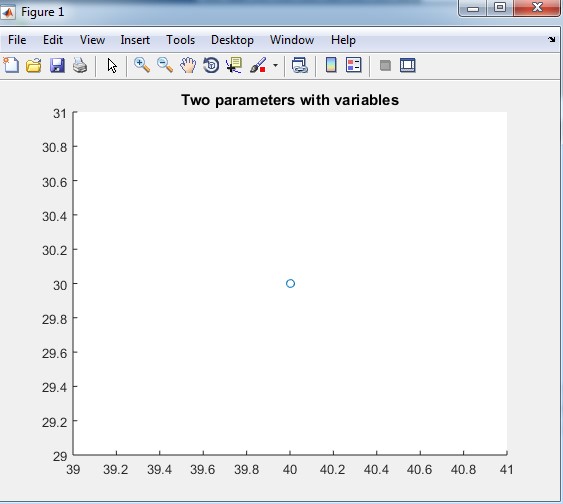
Table 2.3:
| Matlab Editor | Command Window |
| angle=1:10 ip1=cos(angle) ip2=sin(angle) comet(ip1,ip2) title(‘two parameters parameter with range of values’) |
angle = 1 2 3 4 5 6 7 8 9 10 ip1 = 0.5403 -0.4161 -0.9900 -0.6536 0.2837 0.9602 0.7539 -0.1455 -0.9111 -0.8391 ip2 = 0.8415 0.9093 0.1411 -0.7568 -0.9589 -0.2794 0.6570 0.9894 0.4121 -0.5440 |
The output of table 2.3:
Output:
Conclusion
In Matlab plot function is used to plot graphs but plot function has some limits that’s why comet function is used for graphical representation of functions. In the above examples, we have seen various ways to write comet function and representation of a function in graphs with respect to the position of head and tracing of the tail.
Recommended Articles
This is a guide to Matlab Comet(). Here we discuss the introduction and how does Comet() works in Matlab along with steps and methods to use comet() function. You may also look at the following articles to learn more –
