Updated March 4, 2023
Introduction to Arctan Matlab
Arctan in Matlab is one of the trigonometric function. The inverse tangent function of Y is defined as the arctangent of Y. The arctan function works element-wise on arrays. The function’s domains and ranges include real values as well as complex values. For real values of Y, arctan function returns values in the interval of -π/2, π/2 range. And for complex values of Y, arctan function returns complex values. Arctan is used to get the inverse tangent value of Y in Matlab.
Syntax
The syntax for Arctanin Matlab is as shown below:-
X = atan(Y)
How Does Arctanwork in Matlab?
For the Inverse Tangent plotting of the data, we use the arctan and plot statement.
The steps for inverse tangent plotting of the data using arctan and plot statement
Step 1: We take variables and assign values.
Step 2: Then we use atanto get arctan Matlab values of the variable.
Step 3: Then we use a plot statement with appropriate syntax to plot the inverse tangent
the graph to visualize the inverse tangent data.
Examples of Arctan Matlab
Here are the following examples mention below:
Example #1
Let us see an example related to arctanmatlab, for arctanmatlab we use a Matlab syntax as ‘atan’, atan in parenthesis we take that variable names or we directly take the equation for exponential. In this example, we display the inverse tangent value. Firstly we take a variable A. Then we assign the value to variable A. Then we write the equation using arctan function, we take an atanin parenthesis A, the equation is atan(A). And we get the Inverse Tangent value of the given signal by using the arctan statement.
Code:
clc ;
close all ;
clear all ;
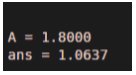
A=1.8
atan(A)
Output:
Example #2
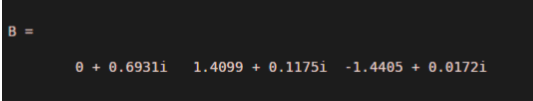
Let us see another example for arctanmatlab, arctanmatlab signal is defined as Inverse Tangent (tan-1) of the elements of X in radians. Here we take a variable namely A. We assign the value, which has both real and complex inputs.0.6i 4+3i -7.5+i this is the input assign to variable A. Then we write the equation using atan function, we take an atan in parenthesis A, the equation is atan(A). And we get the Inverse Tangent value of the given signal by using the arctan statement.
Code:
clc ;

close all ;

clear all ;

A = [0.6i 4+3i -7.5+i];

B= atan(A)
Output:
Example #3
Let us see an example related to arctanmatlab, for arctan we use a Matlab syntax as ‘atan’, atan is parenthesis we take that variable names or we directly take the equation for the inverse tangent. Firstly we take a range of axis -30 to 30 with a difference 0.02, this range we take in an A variable. Then we write the arctan equation using ‘atan’ function, we take an atanin parenthesis A. The value of A varies from -30 to 30, and according to that the different values. Then we plot a signal using A variable and plot function, the plot is an inbuilt function available on Matlab, it plots the signal for the data in A versus the corresponding inverse tangent values in A, the x-axis is A which is varying from -30 to 30, the y-axis is a function of A. And this is inverse tangent signal related to the given equation.
Code:
clc ;

close all ;

clear all ;

A = -30:0.02:30;

plot(A,atan(A))

grid on
Output:
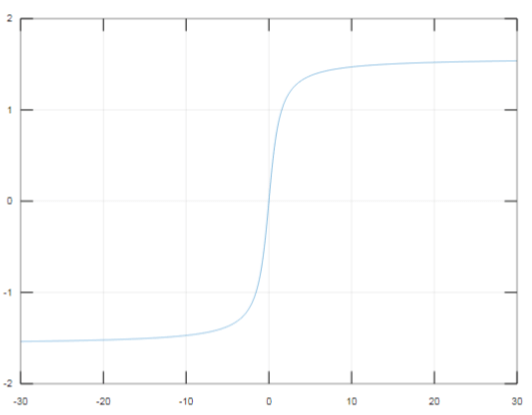
Figure 1
Example #4
Let us see an example for arctanmatlab, the corresponding inverse tangent signal is defined as x1. Where alpha that is x1 is the rate at which tangent signal l is increasing or decreasing n1 is an independent variable which is varying from minus infinity to plus infinity so therefore there are two parameters are here one is alpha and another one is independent variable n1 let me define those two, n1 is usually varying from minus infinity to plus infinity but since we cannot reach infinity so will start with -150 to 150 in a steps of 1. Now define x1 as inverse tangent of n1 is equal to alpha and then stem, stem for discrete signal, the x-axis is n1 which is varying from -150 to 150 comma y-axis is a function of n1.
Code:
clc;

clear all;

close all;

n1 = -150 : 1 : 150 ;

x1 = atan(n1);

stem (n1 , x1);

title ( ' inverse tangent  ' );
Output:
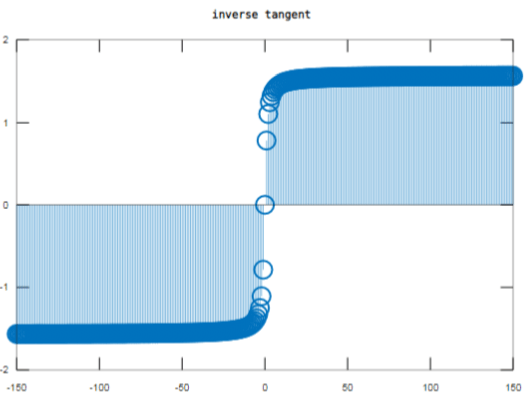
Figure 2
Conclusion
In this article, we saw what is the arctanmatlab. Basically arctan is used to get the inverse tangent value of data. Then saw syntax related to arctanmatlab and how it is used in Matlab code. Also, we saw some examples related to arctanmatlab and its output on Matlab.
Recommended Articles
This is a guide to Arctan Matlab. Here we discuss how does Arctanwork in Matlab along with respective examples for better understanding. You may also have a look at the following articles to learn more –
