EDUCBA

EDUCBA

MENUMENU
  • Free Tutorials
  • Free Courses
  • Certification Courses
  • 360+ Courses All in One Bundle
  • Login

Linear Fit Matlab

By Priya PedamkarPriya Pedamkar

Home » Data Science » Data Science Tutorials » Matlab Tutorial » Linear Fit Matlab

linear fit matlab

Introduction to Linear Fit Matlab

Linear Fit is defined as the fit or regression of fitting the line in such a way that the difference between the actual and predicted value is minimum or line of the best fit is selected in such a way that the error is minimum in those respective points. It describes the relationship between the independent and dependent variables and examines whether there is a linear fit between those variables or not. There are many applications of linear fit like this method that are used to analyze the different pricing and marketing techniques in many industries etc.

How does Linear Fit work in Matlab with Syntax?

In Matlab, the popular and most effective technique that is used to apply linear fit is known as “Least-squares fit” method which states that the line of best fit is adjusted in such a way that the square of the difference between the actual and predicted values (error) is minimum. Before we apply linear fit to any data set, it is always advisable to see whether there is any relationship between the quantities or features, which can be examined by applying correlation analysis to the dataset. If there is a nonlinear relationship between those variables, sometimes the correlation analysis cannot detect it.

Start Your Free Data Science Course

Hadoop, Data Science, Statistics & others

Linear fit follows the below relationship:

Syntax:

Y1=mx1+c

Where,

  • Y1: Target, Dependent or Criterion Variable
  • x1: Independent or predictor variable
  • m: Slope or Regression Coefficient
  • c: constant

Explanation: However, if there is a nonlinear relationship between the dependent and independent variables, then it is better to transform those variables so that there is a linear fit between those variables. We can also test the linearity between the variables in terms of graphical analysis like scatter plot etc. Correlation analysis is also one of the methods to check the relationship between the dependent and independent variables. It calculates the correlation coefficient between the variables and it can be positive or negative. If it a positive correlation coefficient, then the variables are positively correlated while if it a negative correlation coefficient, then the variables are negatively correlated. It can take values from -1 to 1; values that are near to -1 or 1 means that the variables are strongly correlated (may be positive or negative). A correlation coefficient of 0, means that there is a weak relationship between the respective variables.

Examples to Implement Linear Fit Matlab

\ operator in Matlab is used to perform a linear fit between the variables. Please find the below example that depicts the use of \ operator:”

Example #1

Code:

x=12
y=4
b=x\y

Output:

Linear Fit matlab - 1

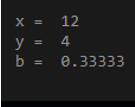
Explanation: Here b is the regression coefficient and the linear fit equation will be y=0.333x if the inputs are given as per the above example.

Residuals in the linear fit are defined as the difference between the actual values of the dependent variable or the response variable and the values that are predicted by the linear model. To produce a linear fit model, the sum of squares of the residuals should be minimum and this minimization is called a least-square fit. If we plot the residuals and we see a definite pattern in the plot and the residual points don’t appear in a random manner, then it is an indication of not a good linear fit. One of the important measures of goodness of linear fit is R^2 or coefficient of determination which measures the amount of variation in the data set. Statistically, it indicates how the obtained values from the model match the dependent variable values that are model is supposed to predict. Please find the below formula that is considered while calculating the coefficient of determination or R^2 value:

Popular Course in this category
Sale
MATLAB Training (3 Courses, 1 Project)3 Online Courses | 1 Hands-on Project | 8+ Hours | Verifiable Certificate of Completion | Lifetime Access
4.5 (9,176 ratings)
Course Price

View Course

Related Courses
R Programming Training (13 Courses, 20+ Projects)All in One Data Science Bundle (360+ Courses, 50+ projects)

R^2=1-RSS/TSS

Where,

  • R^2: Coefficient of determination
  • RSS: Sum of the squared residuals that is obtained from calculating the linear fit
  • TSS: Total sum of the square differences from the mean of the response variable

Example #2

Code:

x=23
y=17
b=x\y

Output:

Linear Fit matlab - 2

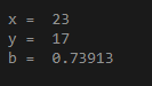
Explanation: Here b is the regression coefficient and the linear fit equation will be y=0.73913x if the inputs are given as per the above example.

Assumption of Linear Fit

Generally, there are certain assumptions that the linear fit model should follow:

  • There should be a linear relationship between the independent and dependent variables that are taken into consideration while applying the equation of linear fit.
  • There should be little or no correlation between the independent variables that are taken into consideration. This phenomenon is known as multicollinearity and it can be avoided by dropping any independent variable that is correlated or we can combine two features as one and apply it in the model.
  • Another assumption of the linear fit is that the errors or residuals across the linearly fitted line should be random and there should not be any definite pattern in the residuals.
  • There should be a normal distribution between the variables that are taken into consideration. Normality can be seen by plotting the values graphically and examining the pattern.

Applications

Many industries use linear fit applications for their business growth and more. Please find some of the applications where we can apply linear fit to the dataset:

  • To predict the sales and revenue of any industry in a certain period of time.
  • To predict the effectiveness of the new marketing techniques that are introduced or analyze the results of different promotions.
  • It is used to make predict and make a forecast in the finance industry.
  • Many insurance companies use this technique to predict the claim in the future and accordingly make the decisions.
  • It is also used the study the dependency between the variables to see whether a particular feature affects a certain feature.

Conclusion

Linear Fit in Matlab is a very important feature to learn since gradually every company and industry use this technique for many purposes. Instead of considering our gut feeling, we can use this technique to see the results practically and make the decisions effectively.

Recommended Articles

This is a guide to Linear Fit Matlab. Here we discuss Syntax to Linear Fit Matlab, how does it work, with examples to implement with assumption and application. You can also go through our other related articles to learn more –

  1. Matlab Count
  2. Matlab Legend
  3. Matlab Cell Array
  4. Matlab stem() | Properties and Examples

All in One Data Science Bundle (360+ Courses, 50+ projects)

360+ Online Courses

50+ projects

1500+ Hours

Verifiable Certificates

Lifetime Access

Learn More

0 Shares
Share
Tweet
Share
Primary Sidebar
Matlab Tutorial
  • Functions
    • MATLAB Functions
    • MATLAB user defined function
    • Calling Functions in MATLAB
    • Transfer Functions in MATLAB
    • Anonymous Functions in MATLAB
    • Inline Functions in MATLAB
    • Bessel Functions in MATLAB
    • Mean Function in MATLAB
    • Find Function MATLAB
    • Filter Function in MATLAB
    • IIR Filter MATLAB
    • Piecewise Function in MATLAB
    • Sum Function in MATLAB
    • Simulink MATLAB Function
    • MATLAB Create Function
    • MATLAB Inverse Function
    • MATLAB Count
    • Step Function MATLAB
    • MATLAB limit
    • fminsearch in MATLAB
    • Covariance in MATLAB
    • Summation in MATLAB
    • Linear Fit MATLAB
    • MATLAB?linear regression
    • MATLAB Derivative
    • MATLAB Derivative of Function
    • MATLAB Comet()
    • Fzero MATLAB
    • xlabel MATLAB
    • Matplotlib Legend
    • Matplotlib Subplots
    • Plot graph MATLAB
    • MATLAB Format
    • MATLAB plot title
    • Multiple Plots in MATLAB
    • MATLAB Indexing
    • Ceil MATLAB
    • Curve Fitting MATLAB
    • MATLAB trapz()
    • MATLAB Normalize
    • MATLAB diff
    • MATLAB sym()
    • MATLAB Syms
    • Absolute Value MATLAB
    • MATLAB Exponential
    • Kalman Filter MATLAB
    • Low Pass Filter MATLAB
    • Bandpass Filter MATLAB
    • MATLAB Unique
    • Trapezoidal Rule MATLAB
    • MATLAB Root Finding
    • MATLAB stem()
    • MATLAB loglog()
    • MATLAB Autocorrelation
    • MATLAB Sort
    • Simplify MATLAB
    • Cumsum MATLAB
    • Eval Function MATLAB
    • Polyval MATLAB
    • MATLAB Colon
    • MATLAB Eigenvalues
    • MATLAB fit
    • Delta Function MATLAB
    • MATLAB Remainder
    • Differentiation in MATLAB
    • Permute MATLAB
    • isempty MATLAB
    • MATLAB text()
    • MATLAB Display Text
    • Varargin in MATLAB
    • MATLAB gca
    • MATLAB fill()
    • MATLAB pcolor()
    • MATLAB min
    • MATLAB xcorr
    • MATLAB? color codes
    • Semilogy MATLAB
    • MATLAB? eye
    • feval MATLAB
    • num2str in MATLAB
    • MATLAB Images
    • MATLAB Image? Segmentation
    • Imagesc MATLAB
    • MATLAB Image Processing
    • MATLAB Image Resize
    • MATLAB Flag
    • MATLAB fopen
    • Strcmp MATLAB
    • MATLAB fwrite
    • MATLAB fft()
    • MATLAB zeros()
    • MATLAB textread
    • Arctan MATLAB
    • MATLAB Scripts
    • Butterworth filter MATLAB
    • MATLAB Findpeaks
    • MATLAB find Index
    • MATLAB Cell
    • MATLAB Unit Step Function
    • MATLAB Backslash
    • MATLAB Mod
    • Size Function in MATLAB
    • Secant MATLAB
  • Basic
    • MATLAB Area Under Curve
    • MATLAB not equal
    • MATLAB max
    • MATLAB exist
    • MATLAB Table
    • MATLAB regression
    • MATLAB Lists
    • MATLAB quantile
    • MATLAB Round
    • MATLAB readtable
    • MATLAB disp
    • MATLAB Standard Deviation
    • MATLAB quadprog
    • MATLAB Transpose
    • Introduction to MATLAB
    • Advantages of MATLAB
    • MATLAB Features
    • Taylor Series MATLAB
    • MATLAB Z Transform
    • fsolve in MATLAB
    • Is MATLAB Free
    • MATLAB QR
    • Career in MATLAB
    • Uses Of MATLAB
    • Is MATLAB Free
    • How to Install MATLAB
    • How to Use MATLAB?
    • MATLAB Version
    • MATLAB Compiler
    • MATLAB Commands
    • MATLAB Block Comment
    • MATLAB? sprintf
    • MATLAB fprintf
    • Data Types in MATLAB
    • MATLAB Integral
    • MATLAB Double Integral
    • MATLAB boolean
    • MATLAB vpa
    • MATLAB Object
    • MATLAB Annotation
    • MATLAB Variables
    • MATLAB Global Variables
    • MATLAB Operators
    • MATLAB Logical Operators
    • MATLAB nan
    • MATLAB Patch
    • MATLAB AND Operator
    • MATLAB OR Operator
    • Vectors in MATLAB
    • What is Simulink in MATLAB
    • MATLAB Interpolation
    • MATLAB Imread
    • fscanf MATLAB
    • Euler Method MATLAB
    • Root Locus MATLAB
    • MATLAB return
    • Bode Plot MATLAB
    • Nargin MATLAB
    • MATLAB Matrix Inverse
    • MATLAB String to Number
    • MATLAB string
    • MATLAB ColorBar
    • MATLAB Surfc
    • MATLAB Concatenate
    • NUMEL MATLAB
    • MATLAB? File Extension
    • MATLAB File
    • MATLAB Smooth
    • MATLAB ones
    • Exponential in MATLAB
    • MATLAB ksdensity
    • MATLAB log
    • MATLAB Append
    • MATLAB hold on
    • MATLAB Magnitude of Vector
    • Heatmap in MATLAB
    • MATLAB xticks
    • MATLAB randn
  • Control Statements
    • IF-Else Statement in MATLAB
    • If Statement in MATLAB
    • Loops in MATLAB
    • For Loop in MATLAB
    • While Loop in MATLAB
    • do while loop in MATLAB
    • Nested Loop in MATLAB
    • Switch Statement in MATLAB
    • Break in MATLAB
  • Matrix
    • Matrix in MATLAB
    • 3D Matrix in MATLAB
    • Transpose Matrix MATLAB
    • Sparse Matrix in MATLAB
    • Matrix Multiplication in MATLAB
    • Identity Matrix in MATLAB
    • MATLAB?writematrix
  • Advanced
    • MATLAB Class
    • Arrays in MATLAB
    • Matlab find value in array
    • Power Spectral Density MATLAB
    • Matlab Textscan
    • String Array in MATLAB
    • MATLAB Random Numbers
    • Matlab Dot
    • MATLAB 2D Array
    • MATLAB? zero padding
    • MATLAB sort matrix
    • MATLAB Plot Function
    • 2D Plots in MATLAB
    • 3D Plots in MATLAB
    • MATLAB Fread
    • Spectrogram MATLAB
    • MATLAB Average
    • MATLAB exponent
    • MATLAB not enough input arguments
    • MATLAB comment
    • MATLAB zpk
    • Scatter Plots in MATLAB
    • MATLAB 3d scatter plot
    • Bar Graph in MATLAB
    • Bar Plot MATLAB
    • Log Plot MATLAB
    • Polar Plot in MATLAB
    • Surface Plot in MATLAB
    • MATLAB Plot Circle
    • Boxplot in MATLAB
    • MATLAB Plot Multiple Lines
    • Linspace MATLAB
    • Histogram in MATLAB
    • Plot Vector MATLAB
    • MATLAB Legend
    • MATLAB Plot Legend
    • MATLAB ezplots
    • Column Vector MATLAB
    • MATLAB Plot Marker
    • MATLAB LineWidth
    • MATLAB Line Style
    • Contour plot in MATLAB
    • MATLAB Sine Wave
    • Reshape in MATLAB
    • Natural Log in MATLAB
    • Random Number Generator in MATLAB
    • Complex Numbers in MATLAB
    • MATLAB Figure
    • Heatmap in MATLAB
    • MATLAB Technical Computing
    • Colors in MATLAB
    • Colormap in MATLAB
    • MATLAB Plot Colors
    • MATLAB fplot()
    • MATLAB Stacked Bar
    • MATLAB sphere()
    • MATLAB cylinder()
    • MATLAB mesh()
    • Pie Chart in MATLAB
    • MATLAB Gradient
    • Grid on MATLAB
    • Repmat in MATLAB
    • dlmread in MATLAB
    • Meshgrid in MATLAB
    • MATLAB Struct
    • MATLAB Cross Product
    • MATLAB colorbar Label
    • MATLAB Save Variable
    • MATLAB Saveas
    • MATLAB Cell Array
    • Polynomial in MATLAB
    • ismember MATLAB
    • Heaviside MATLAB
    • MATLAB rref
    • MATLAB polyfit()
    • MATLAB xlim
    • MATLAB Variance
    • Optimset MATLAB
    • Quiver MATLAB
    • Newton Raphson MATLAB
    • Mat2cell MATLAB
    • Magnitude MATLAB
    • format long MATLAB
    • Dot Product MATLAB
    • Jacobian MATLAB
    • What is Matlab?
    • Convolution MATLAB
    • Moving Average MATLAB
    • Fourier Series MATLAB
    • Gaussian Fit MATLAB
    • Bisection Method MATLAB
    • Laplace Transform MATLAB
    • Fourier Transform MATLAB
    • Signal Processing MATLAB
    • MATLAB Forms
    • Complex Conjugate MATLAB
    • MATLAB Write to File
    • uigetfile MATLAB
    • MATLAB Toolbox
    • MATLAB Errorbar
    • MATLAB Index Exceeds Matrix Dimensions
    • Nyquist MATLAB
    • Impulse Response MATLAB
    • xlsread MATLAB
    • MATLAB xlswrite
    • Matplotlib Scatter
    • MATLAB Import Data
    • MATLAB Export Data
    • MATLAB Read CSV
  • Programs
    • Square Root in MATLAB
    • Square Wave MATLAB
    • Squeeze MATLAB
    • Factorial in MATLAB
    • Cell to String MATLAB
  • Interview Questions
    • MATLAB Interview Questions

Related Courses

MATLAB Certification Course

R Programming Course

All in One Data Science Courses

Footer
About Us
  • Blog
  • Who is EDUCBA?
  • Sign Up
  • Live Classes
  • Corporate Training
  • Certificate from Top Institutions
  • Contact Us
  • Verifiable Certificate
  • Reviews
  • Terms and Conditions
  • Privacy Policy
  •  
Apps
  • iPhone & iPad
  • Android
Resources
  • Free Courses
  • Database Management
  • Machine Learning
  • All Tutorials
Certification Courses
  • All Courses
  • Data Science Course - All in One Bundle
  • Machine Learning Course
  • Hadoop Certification Training
  • Cloud Computing Training Course
  • R Programming Course
  • AWS Training Course
  • SAS Training Course

© 2022 - EDUCBA. ALL RIGHTS RESERVED. THE CERTIFICATION NAMES ARE THE TRADEMARKS OF THEIR RESPECTIVE OWNERS.

EDUCBA
Free Data Science Course

Hadoop, Data Science, Statistics & others

*Please provide your correct email id. Login details for this Free course will be emailed to you

By signing up, you agree to our Terms of Use and Privacy Policy.

EDUCBA

*Please provide your correct email id. Login details for this Free course will be emailed to you

By signing up, you agree to our Terms of Use and Privacy Policy.

EDUCBA
Free Data Science Course

Hadoop, Data Science, Statistics & others

*Please provide your correct email id. Login details for this Free course will be emailed to you

By signing up, you agree to our Terms of Use and Privacy Policy.

Let’s Get Started

By signing up, you agree to our Terms of Use and Privacy Policy.

EDUCBA Login

Forgot Password?

By signing up, you agree to our Terms of Use and Privacy Policy.

This website or its third-party tools use cookies, which are necessary to its functioning and required to achieve the purposes illustrated in the cookie policy. By closing this banner, scrolling this page, clicking a link or continuing to browse otherwise, you agree to our Privacy Policy

Loading . . .
Quiz
Question:

Answer:

Quiz Result
Total QuestionsCorrect AnswersWrong AnswersPercentage

Explore 1000+ varieties of Mock tests View more

Special Offer - MATLAB Certification Course Learn More