EDUCBA

EDUCBA

MENUMENU
  • Free Tutorials
  • Free Courses
  • Certification Courses
  • 360+ Courses All in One Bundle
  • Login
Home Data Science Data Science Tutorials Matlab Tutorial Matlab linear regression
Secondary Sidebar
Matlab Tutorial
  • Functions
    • MATLAB Functions
    • MATLAB user defined function
    • Calling Functions in MATLAB
    • Transfer Functions in MATLAB
    • Anonymous Functions in MATLAB
    • Inline Functions in MATLAB
    • Bessel Functions in MATLAB
    • Mean Function in MATLAB
    • Find Function MATLAB
    • Filter Function in MATLAB
    • IIR Filter MATLAB
    • Piecewise Function in MATLAB
    • Sum Function in MATLAB
    • Simulink MATLAB Function
    • MATLAB Create Function
    • MATLAB Inverse Function
    • MATLAB Count
    • Step Function MATLAB
    • MATLAB limit
    • Fminsearch in MATLAB
    • Covariance in MATLAB
    • Summation in MATLAB
    • Linear Fit MATLAB
    • MATLAB?linear regression
    • MATLAB Derivative
    • MATLAB Derivative of Function
    • MATLAB Comet()
    • Fzero MATLAB
    • xlabel MATLAB
    • Matplotlib Legend
    • Matplotlib Subplots
    • Plot graph MATLAB
    • MATLAB Format
    • MATLAB plot title
    • Multiple Plots in MATLAB
    • MATLAB Indexing
    • Ceil MATLAB
    • Curve Fitting MATLAB
    • MATLAB trapz()
    • MATLAB Normalize
    • MATLAB diff
    • MATLAB sym()
    • MATLAB Syms
    • Absolute Value MATLAB
    • MATLAB Exponential
    • Kalman Filter MATLAB
    • Low Pass Filter MATLAB
    • Bandpass Filter MATLAB
    • MATLAB Unique
    • Trapezoidal Rule MATLAB
    • MATLAB Root Finding
    • MATLAB stem()
    • MATLAB loglog()
    • MATLAB Autocorrelation
    • MATLAB Sort
    • Simplify MATLAB
    • Cumsum MATLAB
    • Eval Function MATLAB
    • Polyval MATLAB
    • MATLAB Colon
    • MATLAB Eigenvalues
    • MATLAB fit
    • Delta Function MATLAB
    • MATLAB Remainder
    • Differentiation in MATLAB
    • Permute MATLAB
    • isempty MATLAB
    • MATLAB text()
    • MATLAB Display Text
    • Varargin in MATLAB
    • MATLAB gca
    • MATLAB fill()
    • MATLAB pcolor()
    • MATLAB min
    • MATLAB xcorr
    • MATLAB? color codes
    • Semilogy MATLAB
    • MATLAB? eye
    • feval MATLAB
    • num2str in MATLAB
    • MATLAB Images
    • MATLAB Image? Segmentation
    • Imagesc MATLAB
    • MATLAB Image Processing
    • MATLAB Image Resize
    • MATLAB Flag
    • MATLAB fopen
    • Strcmp MATLAB
    • MATLAB fwrite
    • MATLAB fft()
    • MATLAB zeros()
    • MATLAB textread
    • Arctan MATLAB
    • MATLAB Scripts
    • Butterworth filter MATLAB
    • MATLAB Findpeaks
    • MATLAB find Index
    • MATLAB Cell
    • MATLAB Unit Step Function
    • MATLAB Backslash
    • MATLAB Mod
    • Size Function in MATLAB
    • Secant MATLAB
  • Basic
    • MATLAB Area Under Curve
    • MATLAB not equal
    • MATLAB max
    • MATLAB exist
    • MATLAB Table
    • MATLAB regression
    • MATLAB Lists
    • MATLAB quantile
    • MATLAB Round
    • MATLAB readtable
    • MATLAB disp
    • MATLAB Standard Deviation
    • MATLAB quadprog
    • MATLAB Transpose
    • Introduction to MATLAB
    • Advantages of MATLAB
    • MATLAB Features
    • Taylor Series MATLAB
    • MATLAB Z Transform
    • fsolve in MATLAB
    • MATLAB QR
    • Career in MATLAB
    • Uses Of MATLAB
    • MATLAB Free
    • How to Install MATLAB
    • How to Use MATLAB?
    • MATLAB Version
    • MATLAB Compiler
    • MATLAB Commands
    • MATLAB Block Comment
    • MATLAB? sprintf
    • MATLAB fprintf
    • Data Types in MATLAB
    • MATLAB Integral
    • MATLAB Double Integral
    • MATLAB boolean
    • MATLAB vpa
    • MATLAB Object
    • MATLAB Annotation
    • MATLAB Variables
    • MATLAB Global Variables
    • MATLAB Operators
    • MATLAB Logical Operators
    • MATLAB nan
    • MATLAB Patch
    • MATLAB AND Operator
    • MATLAB OR Operator
    • Vectors in MATLAB
    • What is Simulink in MATLAB
    • MATLAB Interpolation
    • MATLAB Imread
    • fscanf MATLAB
    • Euler Method MATLAB
    • Root Locus MATLAB
    • MATLAB return
    • Bode Plot MATLAB
    • Nargin MATLAB
    • MATLAB Matrix Inverse
    • MATLAB String to Number
    • MATLAB string
    • MATLAB ColorBar
    • MATLAB Surfc
    • MATLAB Concatenate
    • NUMEL MATLAB
    • MATLAB? File Extension
    • MATLAB File
    • MATLAB Smooth
    • MATLAB ones
    • Exponential in MATLAB
    • MATLAB ksdensity
    • MATLAB log
    • MATLAB Append
    • MATLAB hold on
    • MATLAB Magnitude of Vector
    • Heatmap in MATLAB
    • MATLAB xticks
    • MATLAB randn
  • Control Statements
    • IF-Else Statement in MATLAB
    • If Statement in MATLAB
    • Loops in MATLAB
    • For Loop in MATLAB
    • While Loop in MATLAB
    • do while loop in MATLAB
    • Nested Loop in MATLAB
    • Switch Statement in MATLAB
    • Break in MATLAB
  • Matrix
    • Matrix in MATLAB
    • 3D Matrix in MATLAB
    • Transpose Matrix MATLAB
    • Sparse Matrix in MATLAB
    • Matrix Multiplication in MATLAB
    • Identity Matrix in MATLAB
    • MATLAB?writematrix
  • Advanced
    • MATLAB Class
    • Arrays in MATLAB
    • Matlab find value in array
    • MATLAB Grader
    • Power Spectral Density MATLAB
    • Matlab Textscan
    • String Array in MATLAB
    • MATLAB Random Numbers
    • Matlab Dot
    • MATLAB 2D Array
    • MATLAB? zero padding
    • MATLAB sort matrix
    • MATLAB Plot Function
    • 2D Plots in MATLAB
    • 3D Plots in MATLAB
    • MATLAB Fread
    • Spectrogram MATLAB
    • MATLAB Average
    • MATLAB exponent
    • MATLAB not enough input arguments
    • MATLAB comment
    • MATLAB zpk
    • Scatter Plots in MATLAB
    • MATLAB 3d scatter plot
    • Bar Graph in MATLAB
    • Bar Plot MATLAB
    • Log Plot MATLAB
    • Polar Plot in MATLAB
    • Surface Plot in MATLAB
    • MATLAB Plot Circle
    • Boxplot in MATLAB
    • MATLAB Plot Multiple Lines
    • Linspace MATLAB
    • Histogram in MATLAB
    • Plot Vector MATLAB
    • MATLAB Legend
    • MATLAB Plot Legend
    • MATLAB ezplots
    • Column Vector MATLAB
    • MATLAB Plot Marker
    • MATLAB LineWidth
    • MATLAB Line Style
    • Contour plot in MATLAB
    • MATLAB Sine Wave
    • Reshape in MATLAB
    • Natural Log in MATLAB
    • Random Number Generator in MATLAB
    • Complex Numbers in MATLAB
    • MATLAB Figure
    • Heatmap in MATLAB
    • MATLAB Technical Computing
    • Colors in MATLAB
    • Colormap in MATLAB
    • MATLAB Plot Colors
    • MATLAB fplot()
    • MATLAB Stacked Bar
    • MATLAB sphere()
    • MATLAB cylinder()
    • MATLAB mesh()
    • Pie Chart in MATLAB
    • MATLAB Gradient
    • Grid on MATLAB
    • Repmat in MATLAB
    • dlmread in MATLAB
    • Meshgrid in MATLAB
    • MATLAB Struct
    • MATLAB Cross Product
    • MATLAB colorbar Label
    • MATLAB Save Variable
    • MATLAB Saveas
    • MATLAB Cell Array
    • Polynomial in MATLAB
    • ismember MATLAB
    • Heaviside MATLAB
    • MATLAB rref
    • MATLAB polyfit()
    • MATLAB xlim
    • MATLAB Variance
    • Optimset MATLAB
    • Quiver MATLAB
    • Newton Raphson MATLAB
    • Mat2cell MATLAB
    • Magnitude MATLAB
    • format long MATLAB
    • Dot Product MATLAB
    • Jacobian MATLAB
    • What is Matlab?
    • Convolution MATLAB
    • Moving Average MATLAB
    • Fourier Series MATLAB
    • Gaussian Fit MATLAB
    • Bisection Method MATLAB
    • Laplace Transform MATLAB
    • Fourier Transform MATLAB
    • Signal Processing MATLAB
    • MATLAB Forms
    • Complex Conjugate MATLAB
    • MATLAB Write to File
    • uigetfile MATLAB
    • MATLAB Toolbox
    • MATLAB Errorbar
    • MATLAB Index Exceeds Matrix Dimensions
    • Nyquist MATLAB
    • Impulse Response MATLAB
    • xlsread MATLAB
    • MATLAB xlswrite
    • Matplotlib Scatter
    • MATLAB Import Data
    • MATLAB Export Data
    • MATLAB Read CSV
  • Programs
    • Square Root in MATLAB
    • Square Wave MATLAB
    • Squeeze MATLAB
    • Factorial in MATLAB
    • Cell to String MATLAB
  • Interview Questions
    • MATLAB Interview Questions

Related Courses

MATLAB Certification Course

R Programming Course

All in One Data Science Courses

Matlab linear regression

Matlab linear regression

Introduction to Matlab linear regression

Matlab provides the functionality to implement the linear regression; basically, data models are used to determine the relationship between the response and predictor variables. So linear regression is useful in data models, and it acts as a model coefficient. There are multiple types of linear regression, but the most common is least squares, and it is suitable for both the lines and polynomials as well as other types of linear regression. Before finding the relationship between the response and predictor, it is necessary to analyze the linear relationship between them. That means if there is an existing relationship between them, then we need to analyze first after that to calculate the model coefficient.

Syntax

ployfit(A, B, N)

Explanation

Start Your Free Data Science Course

Hadoop, Data Science, Statistics & others

By using the above syntax, we can find the linear coefficient for the given equation, here we have A and B for the data set, and the N is the degree of the equation. Normally this syntax is suitable for data analysis.

Now let’s see the syntax for the graphics command as follows.

plot(A, B, S)

All in One Data Science Bundle(360+ Courses, 50+ projects)
Python TutorialMachine LearningAWSArtificial Intelligence
TableauR ProgrammingPowerBIDeep Learning
Price
View Courses
360+ Online Courses | 50+ projects | 1500+ Hours | Verifiable Certificates | Lifetime Access
4.7 (86,171 ratings)

Explanation

In the above syntax, we specify the three parameters such as A and B for the data point and S for the symbol. In this syntax, it automatically creates the popup window, and that window shows the data point that is (A and B). This data point is used to specify the linear regression with the symbol and color. So in this way, we can execute the multiple graphics command as per our requirement.

How linear regression works in Matlab?

Now let’s see how linear regression works in Matlab as follows.

We need to follow the several steps to generate the linear regression in Matlab as follows.

1. The first step we need to prepare the data

We need to put our data into a format that fitting to the regression; also, we need to put data that acceptable in a specified function. Input data is placed in an array X, and response data is placed in a separate vector that we call y, or input data is placed in a table or dataset array atable, and response data is placed as a column in atablel. One observation is represented by each row of the input data. Each column corresponds to a single prediction (variable).

For example table or dataset of the array that is atable that indicates the response variable name with value pair.

LR= fitlm(atable, response ‘variable name’, ‘value’);

2. In the second step we need to select the fitting method

Basically, there are three different ways to fit the model as follows.

  1. Least-Squares Fit

Fitlm is a tool for creating the least-squares fit of a model to data. This strategy works well when you have a good idea of the model’s shape and just need to figure out its parameters. When you want to look at a few different models, this strategy is also handy.

  1. Robust Fit

Fitlm and the RobustOpts name-value pair can be used to generate a model that is affected by the outliers. Robust fitting eliminates the need to manually eliminate outliers. Step, on the other hand, does not operate with robust fitting. This means that when you employ robust fitting, you can’t look for a decent model step by step.

  1. Stepwise Fit

In this method, we need to find the data model and after that fit the parameters to the specified model. In this method, we use stepwiselm to start this method. By using this method we can find the best model that is relevant to our terms. When we start this method with constant then it leads to the small model and when we start this method with more than one term then it leads to the complex model.

  1. In the third step we need to select the range of models

In Matlab, there are multiple ways to specify the model for the linear regression such as Brief Name, Terms Matrix, and formula.

  1. Fit model to the specified data

In this step, we can fit the argument for the linear regression by using the fitlm and stepwiselm.

  1. Examine the quality of the model

In this step, we examine the quality of the fitted model and as per the requirement, we can adjust the data model as well as we can display the model by using the mdl command.

Example of Matlab linear regression

Now let’s see the different examples of linear regression in Matlab for better understanding as follows.

Let’s see a simple example of linear regression as follows.

First, we need to create the excel file, here we created a linear.xlsx file and we inserted the following data as shown in the following screenshot as follows.

Matlab linear regression output 1

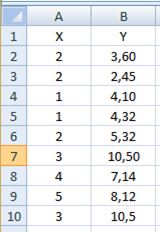
If we use online Simulink then we need to upload excel files and if we use offline mode then we need to create excel files on your specified location that you want. So here we use online mode so first, we need to upload the file.

After successfully uploading the file we need to import the excel file by using the import command that shows on the menu bar.

After importing the .xlsx file we need to execute the following command as follows.
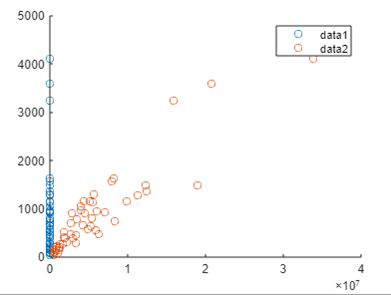
scatter(X,Y)

Explanation

After execution of the above command, we got a graph. The final output of the above statement we illustrated by using the following screenshot as follows.

Matlab linear regression output 2

After that click on the tool menu and select the basic fitting option. In which we can select any option that we want, here we select the liner option and click on the show equation. The final output of the above linear equation we illustrated by using the following screenshot as follows.

output 3

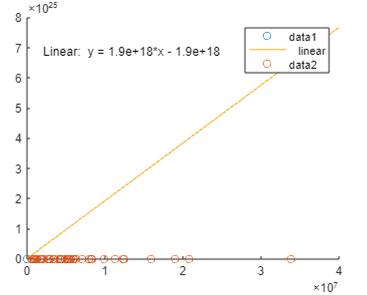
So in this way, we can implement the basic linear regression equation as well as we can perform some mathematical calculations to solve the equation. At the same time, we can plot the graph for the specified linear equation as per requirement.

Conclusion

We hope from this article you learn Matlab linear regression. From the above article, we have learned the basic syntax of linear regression and we also see different examples of linear regression. From this article, we learned how and when we use Matlab linear regression.

Recommended Articles

This is a guide to Matlab linear regression. Here we discuss the basic syntax of linear regression and we also see different examples of linear regression. You may also have a look at the following articles to learn more –

  1. Matlab Mod
  2. Matlab Backslash
  3. Matlab limit
  4. Absolute Value Matlab
Popular Course in this category
MATLAB Training (3 Courses, 1 Project)
  3 Online Courses |  1 Hands-on Project |  8+ Hours |  Verifiable Certificate of Completion
4.5
Price

View Course

Related Courses

R Programming Training (13 Courses, 20+ Projects)4.9
All in One Data Science Bundle (360+ Courses, 50+ projects)4.8
0 Shares
Share
Tweet
Share
Primary Sidebar
Footer
About Us
  • Blog
  • Who is EDUCBA?
  • Sign Up
  • Live Classes
  • Corporate Training
  • Certificate from Top Institutions
  • Contact Us
  • Verifiable Certificate
  • Reviews
  • Terms and Conditions
  • Privacy Policy
  •  
Apps
  • iPhone & iPad
  • Android
Resources
  • Free Courses
  • Database Management
  • Machine Learning
  • All Tutorials
Certification Courses
  • All Courses
  • Data Science Course - All in One Bundle
  • Machine Learning Course
  • Hadoop Certification Training
  • Cloud Computing Training Course
  • R Programming Course
  • AWS Training Course
  • SAS Training Course

ISO 10004:2018 & ISO 9001:2015 Certified

© 2022 - EDUCBA. ALL RIGHTS RESERVED. THE CERTIFICATION NAMES ARE THE TRADEMARKS OF THEIR RESPECTIVE OWNERS.

EDUCBA
Free Data Science Course

SPSS, Data visualization with Python, Matplotlib Library, Seaborn Package

*Please provide your correct email id. Login details for this Free course will be emailed to you

By signing up, you agree to our Terms of Use and Privacy Policy.

EDUCBA Login

Forgot Password?

By signing up, you agree to our Terms of Use and Privacy Policy.

EDUCBA
Free Data Science Course

Hadoop, Data Science, Statistics & others

*Please provide your correct email id. Login details for this Free course will be emailed to you

By signing up, you agree to our Terms of Use and Privacy Policy.

EDUCBA

*Please provide your correct email id. Login details for this Free course will be emailed to you

By signing up, you agree to our Terms of Use and Privacy Policy.

Let’s Get Started

By signing up, you agree to our Terms of Use and Privacy Policy.

This website or its third-party tools use cookies, which are necessary to its functioning and required to achieve the purposes illustrated in the cookie policy. By closing this banner, scrolling this page, clicking a link or continuing to browse otherwise, you agree to our Privacy Policy

Loading . . .
Quiz
Question:

Answer:

Quiz Result
Total QuestionsCorrect AnswersWrong AnswersPercentage

Explore 1000+ varieties of Mock tests View more