Updated June 12, 2023
Introduction to Lean Analytics
Lean Analytics is a methodology for measuring and optimizing business performance by focusing on key metrics, making data-driven decisions, and iterating quickly. It’s based on the Lean Startup approach, which emphasizes speed, experimentation, and a focus on customer needs.
Many successful companies have used the Lean Startup methodology for growth and success. In approximately 15 months, Dropbox went from 100,000 registered users to over 4,000,000 using the Lean Startup methodology. Lean analytics is part of the Lean Startup methodology, consisting of building, measuring, and learning.
Lean Analytics is a multi-stage process that includes defining critical metrics, setting goals, gathering and evaluating data, and acting on insights. Companies can boost productivity, boost income, and gain a competitive advantage in the market by utilizing lean analytics.
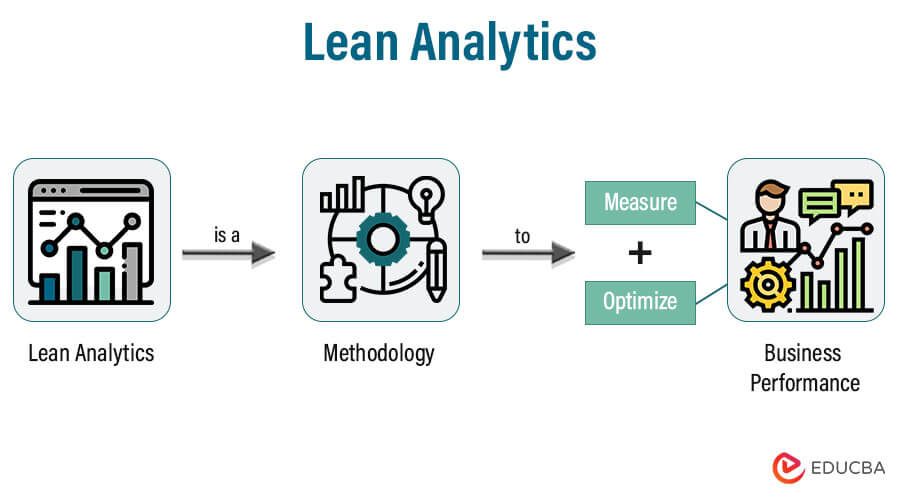
Table of Contents
- Introduction
- Lean Analytics Cycle
- Lean Analytics Stages
- Creating a Lean Business Model
- Types of Metrics in Lean Analytics
- Characteristics of Good Metrics
- The One Metric That Matters (OMTM)
- Lead Analytics Cycle
- Final Thoughts
- Frequently Asked Questions (FAQs)
- Recommended Articles
Key Highlights
- Lean Analytics is a framework for startups and small businesses to measure and optimize performance.
- The framework’s primary goal is to iterate fast to make decisions based on data while finding the essential criteria that drive business performance.
- Companies can employ various lean analytics implementation techniques, such as A/B testing, consumer feedback loops, and data visualization tools.
- Any organization may utilize lean analytics to drive performance and accomplish its goals if they have the correct strategy and resources.
Lean Analytics Cycle
The Lean Analytics Cycle is a framework used by startups and businesses to continuously improve and refine their products and services based on data-driven insights. The cycle consists of six steps:
- Ideas: Generate ideas for a product or service and establish hypotheses about one’s target audience and market.
- Build: Build an MVP (Minimum Viable Product) or prototype that can be tested by early adopters or a smaller group of customers.
- Product: Refine the product based on feedback from early adopters or beta testers to make it more valuable to your target audience.
- Measure: Define key performance indicators (KPIs) that can help you measure the success of your product or service.
- Data: Collect data on KPIs using tools such as Google Analytics or Mixpanel to gain insights into customer behavior and product usage.
- Learn: Analyze the collected data to learn about what’s working and what’s not, and use those insights to inform the next cycle of the lean analytics process.
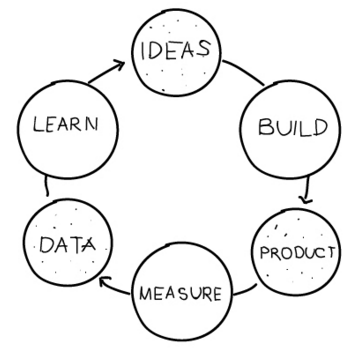
By repeating these steps in a continuous cycle, businesses can make data-driven decisions that help them create products and services that better meet the needs of their customers and drive growth.
Lean Analytics Stages
In the Lean Analytics stages, there are gates that the company needs to pass through to get to the next stage. The five lean analytics stages and their gates are-
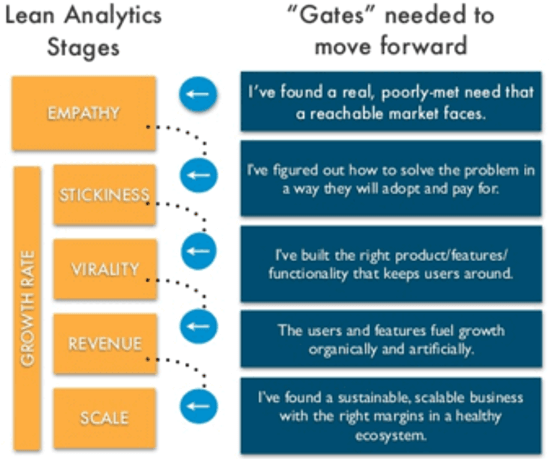
Stage 1: Empathy – In this stage, one must understand your customers and their needs. Spend time observing and talking to customers to gain insights into their behavior, desires, and pain points.
Stage 2: Stickiness – In this stage, one needs to focus on creating a product or service that will keep your customers engaged and returning for more. This involves identifying the key features that customers value and optimizing the product to deliver on those features.
Stage 3: Virality – In this stage, one needs to focus on making your product or service go viral by getting customers to share it with others. This involves identifying the key factors that lead to viral growth and optimizing products or services to encourage sharing and word-of-mouth promotion.
Stage 4: Revenue – This stage focuses on generating revenue from your product or service. This involves identifying the most effective revenue model for the business and optimizing the product or services to maximize revenue.
Stage 5: Scale – In this stage, focus on scaling the business by increasing the number of customers, expanding into new markets, and improving operational efficiency. This involves identifying the key factors driving growth and optimizing your business for sustainable, long-term development.
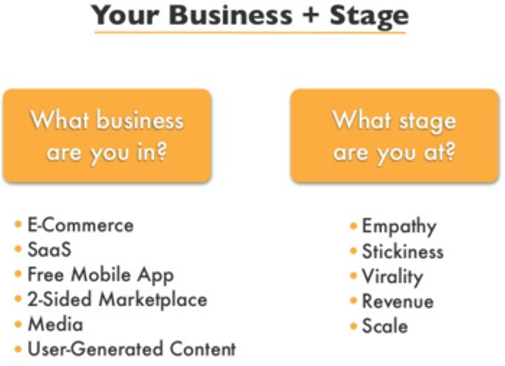
Creating a Business Model with the Lean Analytics Framework
The Lean Analytics framework helps determine the stage of one’s business. A business model should consider the customers and their buying process. Hence, it is essential to ask important questions before framing a business model, such as
- How do customers buy a particular product?
- Why do they purchase the product from one’s business?
- At which stage is one’s business?
- What is the budget of one’s customers?
It is essential to refrain from copying other business models. Rather, framing one’s business model suited to one’s customers is more important.
Types of Metrics in Lean Analytics
Metrics in Lean Analytics refer to the quantitative measurements used to evaluate the success or failure of a business or product. They provide insights into the behavior of customers and the performance of the product or service.
- Vanity Metrics: These metrics may look impressive but do not provide any real insight into the business’s health. Examples include the number of likes on social media or the number of app downloads.
- Actionable Metrics: These metrics can be directly tied to specific actions, such as the number of clicks on a call-to-action button or sign-ups for a free trial.
- Leading Metrics: These metrics predict future outcomes, such as customer engagement or churn rates.
- Lagging Metrics: These metrics measure past performance, such as revenue or customer retention rates.
- Exploratory Metrics: These allow one to gain insights into a specific business area. They are often used when one is unsure what to measure. The goal of exploratory metrics is to help you discover new information to improve the business.
- Reporting Metrics: These track progress towards a specific goal. They are often used when one already knows what to measure and tries to monitor performance over time. Reporting metrics help understand whether the business is moving in the right direction or not.
Selecting the right metrics for a business is essential, as tracking too many metrics can lead to analysis paralysis. Meanwhile, following the wrong metrics can lead to misinterpretation of data and poor decision-making.
Characteristics of Good Metrics in Lean Analytics
Good metrics in lean analytics should have the following characteristics.
- Actionable: The metric should provide insight that can be acted upon to drive growth and improvement.
- Accurate: The metric should be based on reliable data and calculations.
- Timely: The metric should be available in a timely manner so that actions can be taken quickly.
- Relevant: The metric should be relevant to the business goals and objectives.
- Simple: The metric should be easily understood and communicated to all stakeholders.
- Comparative: The metric should be comparable to other metrics and benchmarks to provide context and allow for analysis.
- Scalable: The metric should be scalable and adaptable to changing business needs.
- Cohesive: The metric should fit with other metrics to provide a complete picture of business performance.
- Measurable: The metric should be quantifiable and have a clear definition and methodology for measurement.
By focusing on these characteristics, organizations can ensure that their metrics are meaningful, practical, and actionable in driving business growth and success.
The One Metric That Matters (OMTM)
- Getting knowledge about the metrics is not enough. One should know which metric to be used at which stage of business.
- The One Metric That Matters (OMTM) is a concept in lean analytics that refers to the most critical metric a business should focus on to achieve its goals.
- The OMTM is different for every business and should be chosen based on the company’s overall strategy and objectives.
- The OMTM should be a metric that directly impacts the success of the business, and it should be tracked and analyzed regularly.
- By focusing on the OMTM, businesses can ensure that they are making data-driven decisions and taking actions that will impact their growth and success.
- Focus is an essential resource in lean analytics. Every stage requires one particular metric that one needs to work on.
- Select one metric to work with and fix the target after research. One can decide on a target by researching competitors’ strategies and benchmarks.
Example
A company had its OMTM as churn. Their target is to keep the churn rate below 4%. So if the churn rate is less than or equal to 4%, it means that their target is achieved. If the churn rate is more than 4%, then it means that the company is in a problem, and they need to take measures to decrease the churn rate.
Lean Analytics Cycle
Various steps involved in the Lean Analytics cycle are as follows.
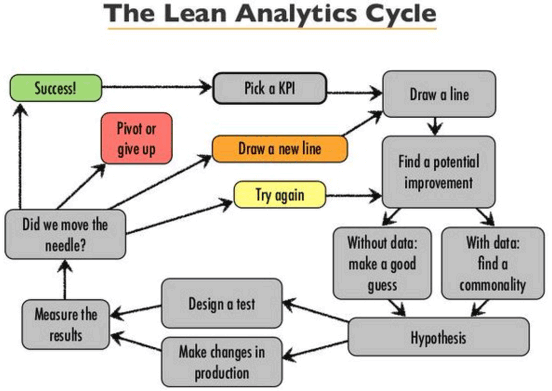
1. Find What to Improve
- Understand the business in-depth and take help from others to find the critical metric relevant to your business.
- Then, connect the metric to a KPI (Key Performance Indicator). For example, if the metric is conversion rate, then KPI is the number of customers buying the product.
- Write down three crucial business metrics and the KPIs for each metric.
2. Form a Hypothesis
- The hypothesis gives the answer to questions such as what the outcome will be if a particular step is taken.
- A hypothesis will help get into the audience’s minds by asking questions and understanding their behavior.
- Collect data by studying the market, conducting surveys, studying competitor strategies, and realizing the metric causing the significant impact.
3. Conduct an experiment
After framing a hypothesis now, convert it into an experiment by asking three questions-
- Who is the target audience?
- What does one expect the target audience to do?
- Why should the audience do that?
This allows one to get a deeper understanding of their customers. Creating an experiment can be defined in a single sentence like
“WHO will do WHAT because WHY to improve KPI towards the defined goals or target.”
4. Measure Outcomes
- If the experiment is a success, then the metric is done. Find out the following metric to work with.
- If the experiment fails, then revise the hypothesis. Also, try to identify the reasons for the failure.
- Describe a new experiment if the experiment has moved away and is not near the defined goals.
Final Thoughts
For startups and small organizations, lean analytics offers a potent foundation for measuring, analyzing, and improving performance. Businesses can use data to make data-driven decisions that support their growth and success by concentrating on critical indicators and finding areas for development. Lean analytics implementation calls for dedication to constant measurement and iteration and a thorough understanding of the methodology. Yet, the advantages are obvious: better performance, higher income, and a competitive advantage in the market.
Frequently Asked Questions (FAQs)
1. What is Lean Analytics used for?
Answer: Lean analytics is used to help startups and businesses measure, analyze and learn from their data to make informed decisions and achieve growth.
2. What is the Lean Analytics cycle?
Answer: The Lean Analytics cycle is a six-step process that includes:
- Identifying key ideas and questions
- Building a product or feature
- Defining the key metrics
- Measuring those metrics
- Analyzing the data
- Learning and making decisions based on the insights gained.
3. What makes a good metric in Lean Analytics?
Answer: Good metrics in Lean Analytics are characterized by being relevant, actionable, understandable, comparative, and focused on the customer. They should also be easy to measure, track and communicate and should align with the goals of the business or product.
Recommended Articles
We hope that this EDUCBA information on “Lean Analytics” was beneficial to you. You can view EDUCBA’s recommended articles for more information.
- Real-Time Analytics
- Business Analytics Techniques
- Data Analytics Technique
- Customer Analytics Techniques

