Updated June 7, 2023
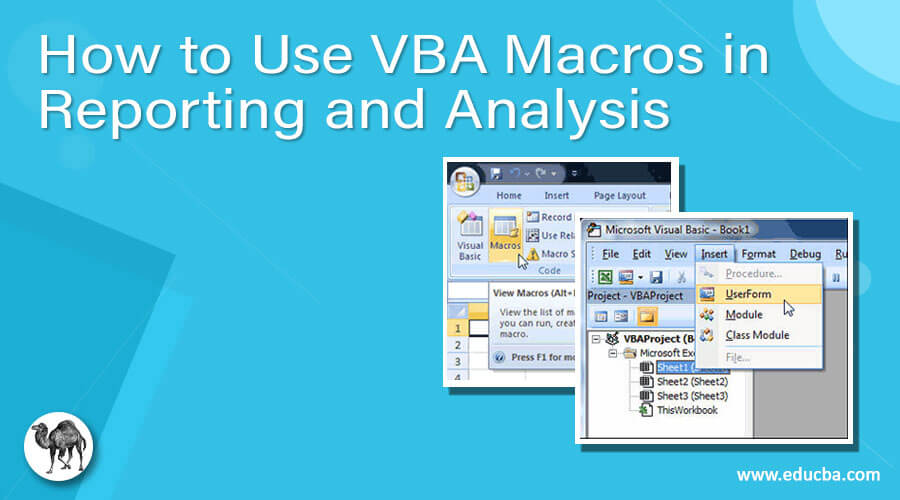
What are Visual Basic Applications ( VBA Macros)
VBA is a programming language developed by Microsoft for Microsoft Office packages such as Word, Access, Excel, and others. It is used to customize the applications to meet the needs of the business. It is a powerful and convenient tool to perform an operation repeatedly and helps analyze the data. VBA is used to access the functions of applications and controls them within other applications. VBA Macros are used to effectively and efficiently perform financial reporting and analysis.
VBA in Excel generates, formats, and prints report using graphical representations like charts. The reports are easily generated, and it is simple with the help of VBA Macros. The reports are generated using various options as per the need of the management.
Using VBA Macros in Excel for Reporting
To use VBA in Excel, you should ensure that the Developer tab is in the Menu tab.
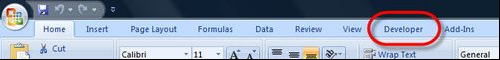
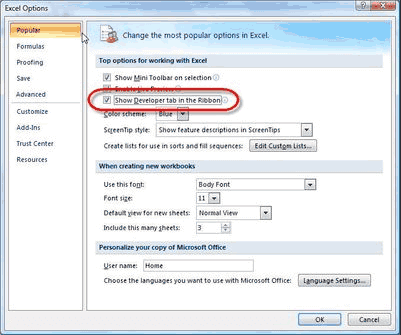
If the Developer Option is unavailable in the Menu tab, then Go to Office Button à Excel Options à Click on the Show Developer tab. Check the box and click Ok.
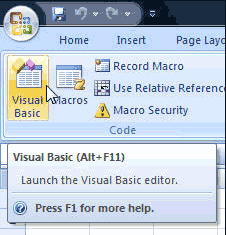
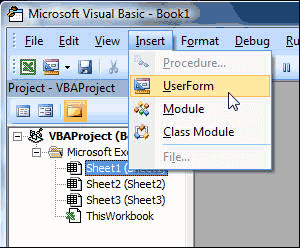
After making this option available, you can start using Visual Basic. Under the Developer tab, click the Visual Basic option
Click Insert Menu à User Form option
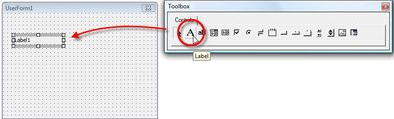
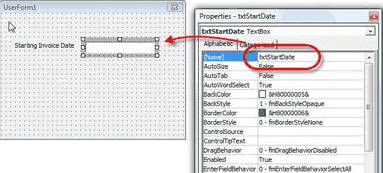
Select Label option from the Toolbox
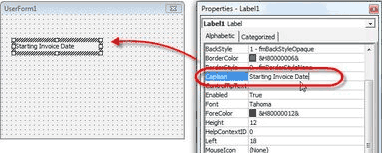
Right Click on the Label, and you will get the Properties Dialog box where you can enter a Caption for the Label.
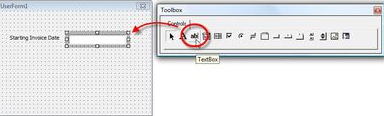
Select the Text box icon from the Tool Box and keep it next to the Label box. And then right, click on the Text Box, and in the Properties Pop-Up menu, enter a Name for the Text Box in the Name Property.
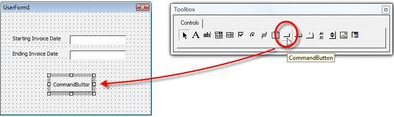
Repeat the steps to add as many labels and text box you want to enter in the User Form area.
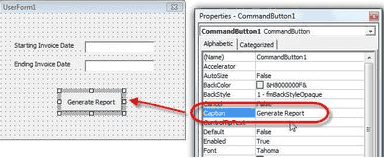
Now select the Command Button option from the Toolbox and place it in the form. Right-click and from the properties pop-up, Enter the command you want from the Captions Property.
Once all the user interface data has been entered, the code must be inputted to generate the report. To open the Code Window double, click on the Command Button in the form.
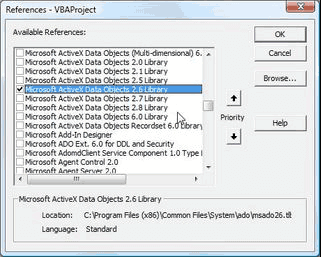
Before the code is inserted, you must set a reference to help you access the VB database. To select references, Tools Menu à References
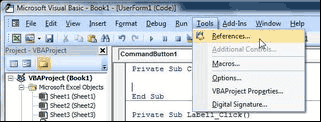
Select the type of Library you want to use from the Dialog Box. The Microsoft ActiveX Data Objects 2.6 Library check box is selected in this picture.
In the Code, Window enters the code used to Run the command. The Code is Placed between “Private Sub CommandButton1_Click()” and End Sub.
You can also add functions in the Code Window to generate the report.
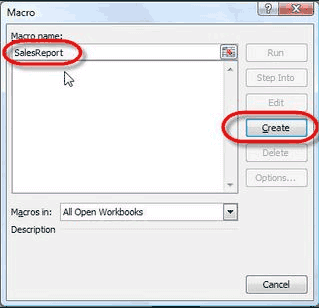
After entering the code, you need to create Macros for the data. Go to Developer Tab à Macros to use the Macros Menu.

Enter a Macro Name for the report and click Create Button.
Enter a code for the form between Sub and End Sub option
After all these steps are done, you are all set to run the report.
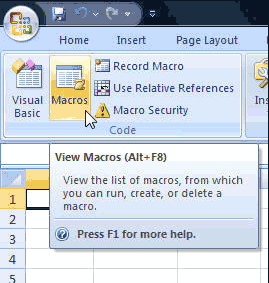
To run the report, follow the below steps:
Click on Macros Menu under the Developer tab
Select the Macro Name from the list and Click on the Run button
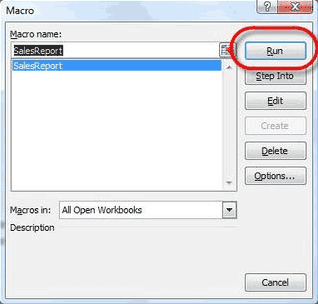
Enter the necessary details to generate the report.
Finally, the report is generated as per your need.
Understanding Variables, Conditions, and Loops in VBA
First, let’s see what all three terms mean in VBA
Variable – It is a small part of the system’s memory that is used to store data
Condition – It is a logical check which the computer performs to test something
Loop – It is a set of instructions that is to be followed for a particular number of times
Now we shall see how to use all these three in VBA
Creating Variables in VBA Macros
If you want to use a variable in VBA Macros, you first need to create them. DIM is the statement that is used to create any variable.
Following are a few examples of variables created
- Dim someNumber As Integer – This tells you you will only use some Number variable to store Integer values. This is used in VBA as someNumber = 7, which means it stores 7 into the variable someNumber
- Dim myList(1 To 10) As String – This line means you want to use a list of values as String (Text). And the list size is limited to 10. This is used as myList(5) = 792, which means it sets the value of the 5th item in myList array to 792.
- Dim otherNumber As Double
- Dim anotherList() As Variant
- Dim someText As String
- Dim myCells As Range
- Dim myChart As Chart
- Dim aCondition As Boolean
Using Conditions in VBA Macros
Everything in computers involves decision-making and testing conditions. There are a lot of statements to test conditions. A few are explained below for your understanding
If Then Statement
Using the If statement is really easy in VBA Macros. Here is an example to test the purchase condition
If ourPurchase < 600 or ourPurchase > 6000 then
‘special instructions to handle too many or too few purchases
end if
Else Statement
Else statement is used when an If condition is failed.
If ourPurchase < 600 or ourPurchase > 6000 then
‘special instructions to handle too many or too few purchases
Else
‘Note down the purchases and move on
end if
Using Loops in VBA Macros
There are several ways to write loops in VBA. Here we have mentioned the easiest type of Loop for your easy understanding
For Loop
A For Loop is utilized to repeat a set of instructions for a specified number of times.
For storeNumber = 20 to 50
‘call the store
‘ask for sales figure
‘do something if needed
‘hang up
Next storeNumber
For Each Loop
This type of loop is used to run the same instructions for each of the items in a list.
For Each cell in Range(“B1:B10”)
cell.value = cell.value + 2
Next cell
Shortcuts
There are a few important shortcuts you should know while using VBA in Excel
- ALT + F11 – To view VBA Editor, also known as VBE
- ALT + F8 – To display all macros
- ALT+Q: To close VBA Editor and return to Excel
- F5: To run a Macro
- F2: Display Object Browser
- F7: Display code editor
- CTRL+G: Open an immediate window
- F1: Display help
Analysis ToolPak
Analysis ToolPak is an add-in program that is a default built-in program in Microsoft Excel. It is a data analysis tool and helps in financial, statistical, and engineering data analysis. You can always save your time and energy by using Analysis ToolPak.
You just need to provide the data for the analysis, and Analysis ToolPak uses the appropriate macro function and displays the result in the output table. They also produce charts sometimes along with the reports.
To load the Analysis ToolPak follow these simple steps
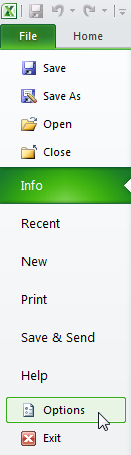
Go to the Green File Tab and click on Options
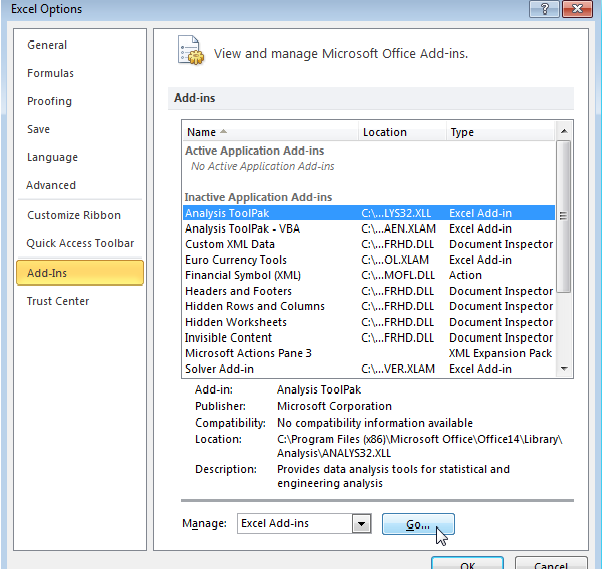
In the Manage drop-down box, select Excel Add-ins and then click Go
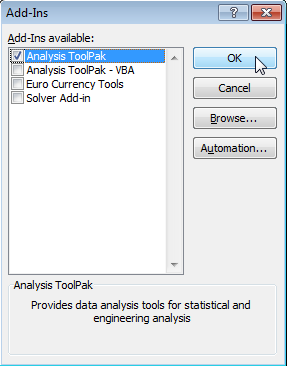
In the Add-ins dialog box, select Analysis ToolPak to check box and click Ok.
If the Analysis ToolPak option is unavailable, click the Browse option. Select the check box against the Analysis ToolPak option and click Ok if available.
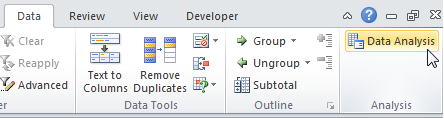
Now in the Data tab, you can click on Data Analysis
Finally, you can select an option that needs to be done in Excel. In the below picture, Histogram is selected to create a Histogram in Excel for the given data.
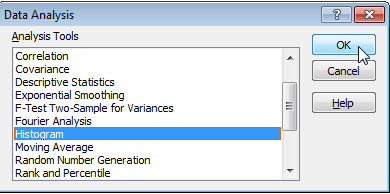
There are totally 19 data analysis options available in Analysis ToolPak. They are listed below
- Anova: Single Factor
- Anova: Two-Factor with Replication
- Anova: Two-Factor Without Replication
- Correlation
- Covariance
- Descriptive Statistics
- Exponential Smoothing
- F-Test Two-Sample for Variance
- Fourier Analysis
- Histogram
- Moving Average
- Random Number Generation
- Rank and Percents
- Regression
- Sampling
- t-Test: Paired Two Sample for Means
- t-Test: Two-Sample Assuming Equal Variances
- t-Test: Two-Sample Assuming Unequal Variances
- Z-Test: Two-Samples for Mean
A few of these data analysis methods are explained in detail below, with screenshots of the same
Descriptive Statistics
Once Analysis ToolPak is installed, you will get the Data Analysis dialog box with a list of choices. Choose Descriptive Statistics. After choosing this option, you will get a dialog box, as shown in the picture below
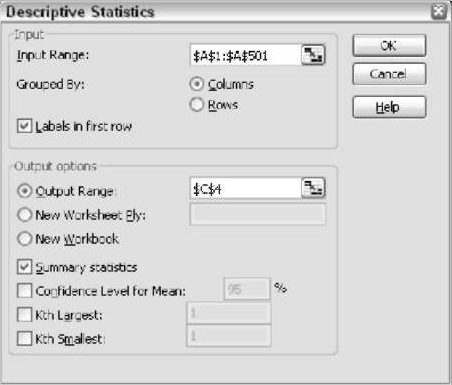
In the dialog box, you can enter the details like the source data range, where the results have to be displayed, and what results will be displayed. Below is the output of descriptive statistics
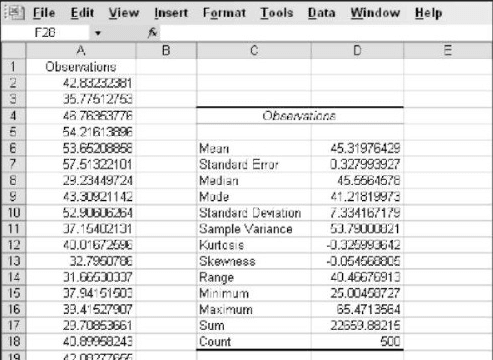
One major disadvantage of using the Descriptive statistics option is that it displays the result as values and not in the term of formulas. So if any change is made to the source data, it will not be reflected in the output. You need to redo the entire method from the beginning.
Creating Histogram
Histogram is a set of counts within particular ranges. The ranges are known as bins in Histogram. From the same Data Analysis dialog box, select the Histogram option. You will get a dialog box as represented in the picture below
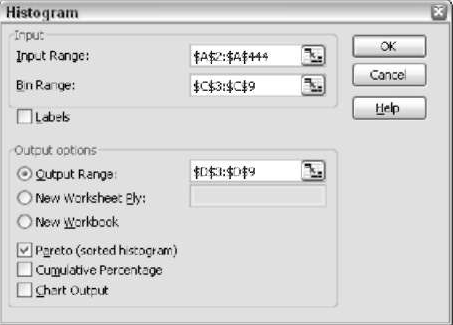
You need to enter the details like the range of the source data, the range of the bin designations, and where the result has to be displayed. The result will show you the distribution of data along with the parameters as shown in the picture below
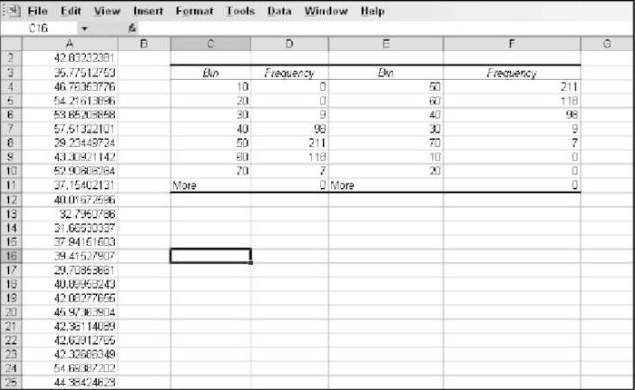
The histogram dialog box also allows you to produce a chart along with the output. This will give you an easy understanding.
Moving Averages
This option will help you to identify trends in sequential data. The source data in this case is based on periods, and the average is always calculated for a specific number of periods. Below given is the Moving Averages dialog box

In this dialog box, you can select the range of the source data, the interval step, and the output range. The interval step is the main factor of Moving Averages, as the output is based on that. This also gives you the option to create a chart in the output, as shown below
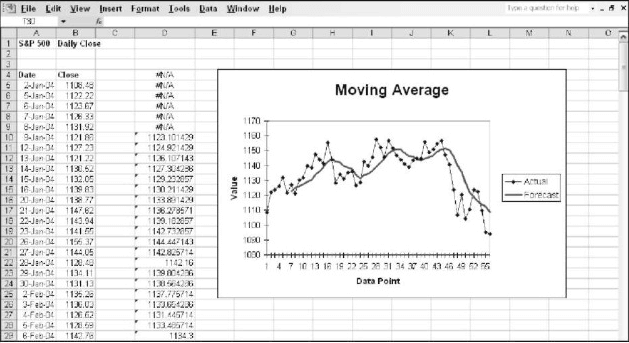
This figure shows that the 6 cells starting from D4 do not return any value as we have entered the Interval step as 7.
Advanced Random Number Generation
This is one of the options in the Data Analysis dialog box. Once selected, you will get the Random Number Generation dialog box below.
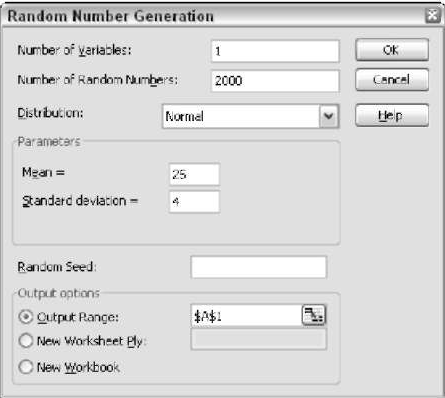
Even Excel has this option, but the Random Number Generation option in Analysis ToolPak is much more advanced than that of Excel. Here you can have more control about
- Number of Variables
- Number of Random Numbers
- Random Speed
In the dialog box, you can see a drop-down list box where you can select the distribution type and parameters for each distribution.
Creating Random sample
One of the options in the Data analysis dialog box is Sampling. Clicking this option will show you another dialog box, as shown in the picture below
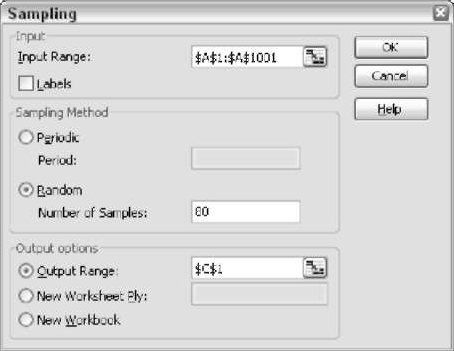
Statistical analysis is mostly done on a population sample, not the entire population. This dialog box allows you to enter the source population data and where the data must be placed. You can select the sampling method. If you select Periodic Method, then you can follow the step pattern. If you select the Random method, you should provide the number of values that should be returned.
This method is very easy and can help you to generate a sample instantly.
Conclusion
Thus using VBA for reporting and analyzing is a wise decision for accounting and financial professionals as it reduces their time and effort. It also provides accurate information in various forms efficiently and effectively.
