Updated August 21, 2023
Excel Grouping Columns
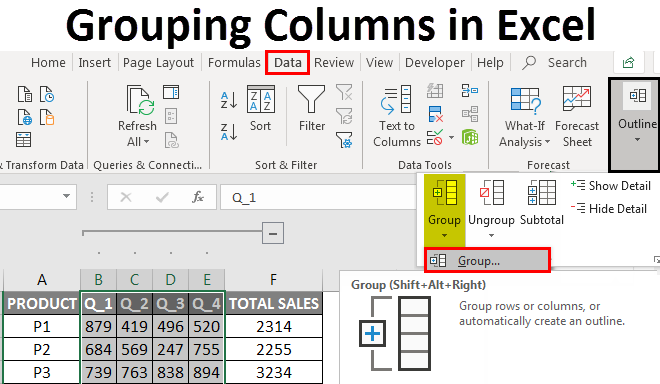
Sometimes the worksheet contains complex data, which is very difficult to read & analyze. To Access & read these types of data more easily, the grouping of cells will help you out. Grouping of columns or rows is used if you want to visually group items or to monitor them in a concise & organized manner under one heading or if you want to hide or show data for better display & presentation. Grouping is very useful & most commonly used in accounting & finance spreadsheets. Under the Data tab in the Ribbon, you can find the Group option in the outline section. In this topic, we will learn about Grouping Columns in Excel.
Shortcut Key to Group Columns or Rows
Shift+Alt+Right Arrow is the shortcut key to group columns or rows, whereas
Shift+Alt+Left Arrow is the shortcut key to ungroup columns or rows.
Definition Grouping of Columns in Excel
It’s a process where you visually group the column items or datasets for a better display.
How to Enable Grouping of Columns in Excel?
Let’s check out how to group columns & How to collapse & expand columns after grouping columns.
Example #1 – Grouping of Columns in Excel
Grouping columns in Excel works well for structured data where it should contain column headings and not have blank column or row data.
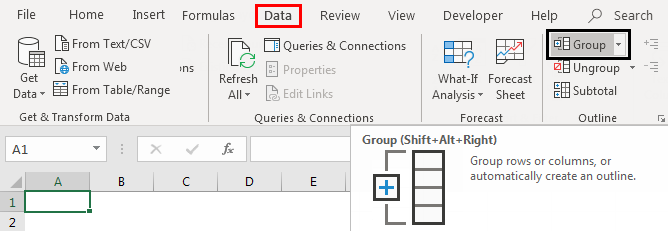
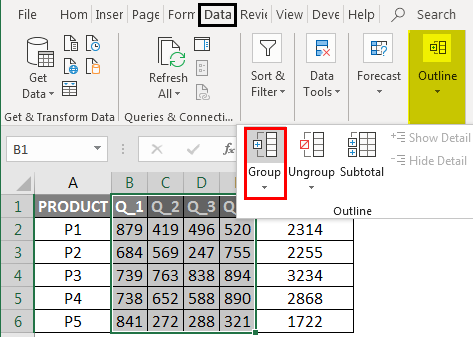
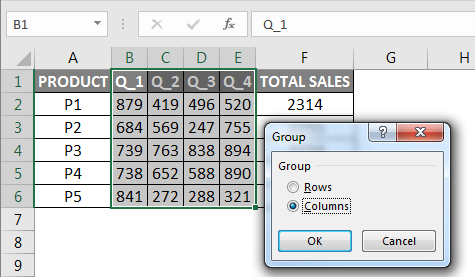
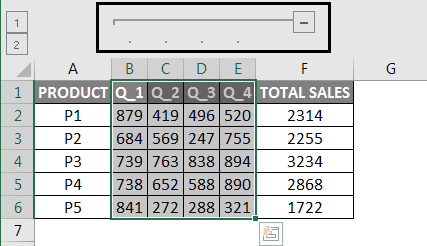
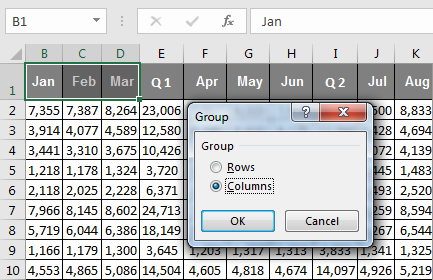
Initially, you must select the column you want to group (i.e., B, C, D, and E columns). Go to the Data tab, then click on the group option under the outline section.
Click on the columns and then press OK.
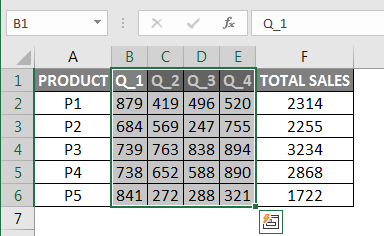
Now you can observe in the data the columns are grouped perfectly, and the outline bars you can observe at the top represent different levels of data organization. Grouping also introduces a toggle option, or it will create a hierarchy of groups, known as an outline, to help your worksheet appear organized, where each bar represents a level of organization (Grouping is also referred to as Outlines.)
How to Collapse & Expand Columns After Column Grouping
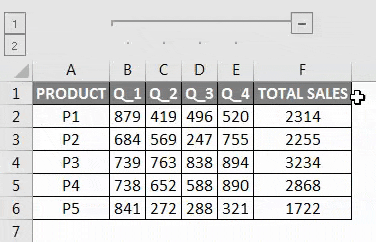
you can press the “-” buttons in the margin to collapse the columns (B, C, D, and E Columns completely disappear), or in case you want to expand them again, press the “+” buttons in the margin (B, C, D, E Columns appears)
Another way to access data is the use of 1 or 2 options on the left side of the worksheet, i.e. it is called a state, 1st option is called a hidden state (if you click on it, it will hide B, C, D, E Columns,) whereas 2nd option is called unhidden state, it will expand those hidden columns, I.E. B, C, D, E Columns appears
To Ungroup Columns in Excel
Select the columns you wish to ungroup (i.e., the one,s you have previously grouped). On the Data tab, in the Outline group, click on Ungroup command.
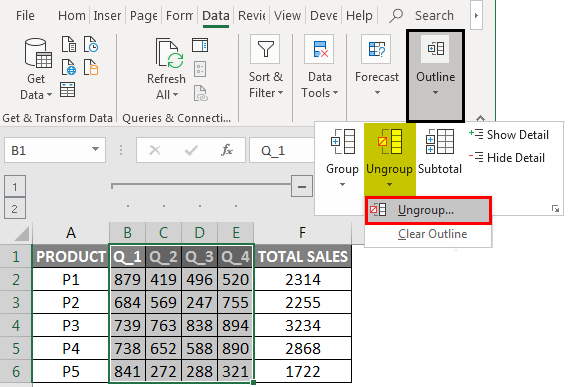
Click on the columns and then press OK.
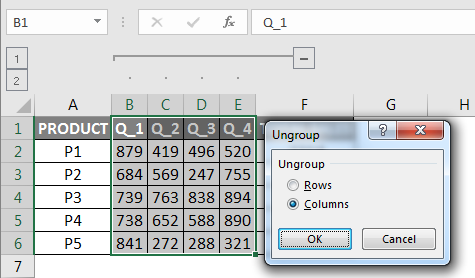
Now, you can observe data bars & “+” buttons and “-” buttons disappear in the Excel sheet once the ungroup option is selected.
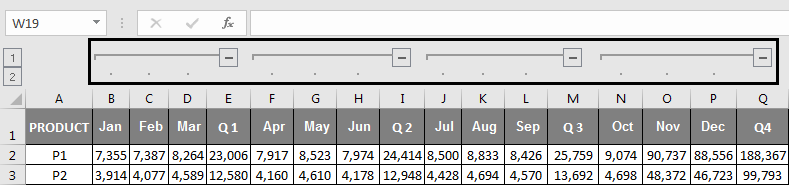
Example #2 – Multiple Grouping of Columns for Sales Data in Excel
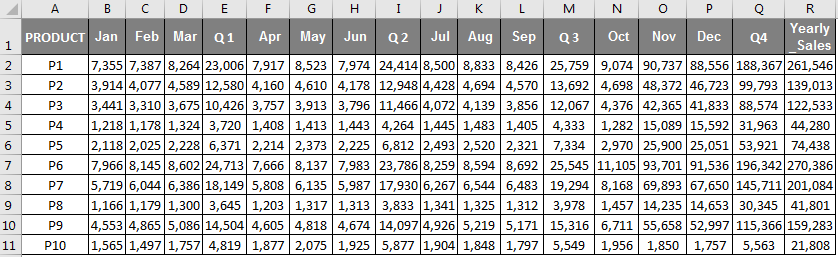
In the below-mentioned example, the Table contains product monthly sales data from Jan to Dec, which is also represented in quarterly & yearly sales.
Here the data is structured and contains no blank cells, hidden rows, or columns.
I don’t want all the monthly sales data to be displayed; I want only quarterly & yearly sales data to be displayed; it can be done through multiple grouping of column options.
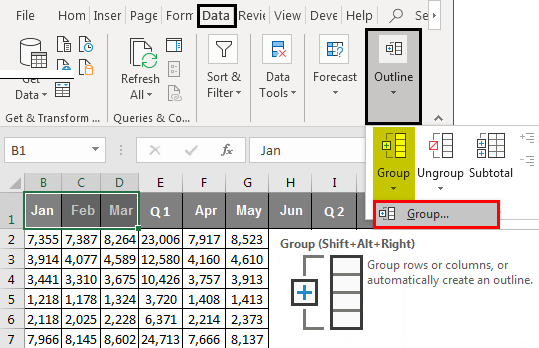
Go to the Data tab in the Home ribbon, which will open a toolbar below it. Initially, I need to select the column I want to group it; now, let’s select the months (i.e., Jan, Feb, and Mar columns). Then click on the group option under the outline section; now, you can observe that the columns are grouped perfectly in the data.
Click on the columns and then press OK.
A similar procedure is applied or followed for the month of Apr, May, Jun & Jul, Aug, Sep & Oct, Nov, and Dec columns.
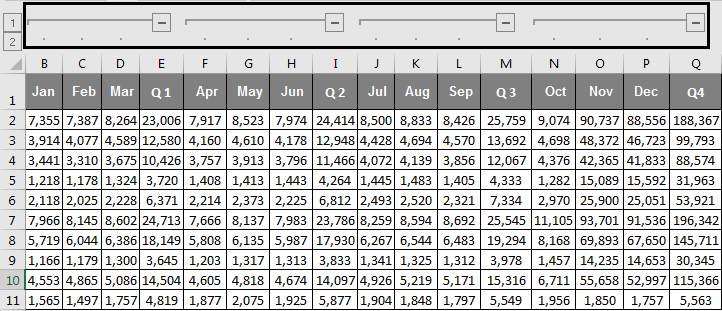
Once the grouping of the above-mentioned monthly columns is done, you can observe that the columns are grouped perfectly in a dataset. The four outline bars at the top represent different data organization levels.
Collapsing & Expanding Columns After Column Grouping
You can press the “–” symbol or buttons in the outline bar to collapse all the month columns; once you are done, you can observe all the month Columns completely disappear, and Positive or “+” buttons in the outline bar appear.

Now, the sales data looks in a concise & compact form, and it looks like well-organized & structured financial data. If you want to check any specific monthly sales data, you can expand them again by pressing the “+” buttons in the outline bar so that all the monthly sales data will appear.
Another way to access or hide monthly data is the use of 1 or 2 options on the left side of the worksheet, i.e., it is called a state, 1st option is called a hidden state (On a single click on it, it will hide all the month Columns) whereas 2nd option is called unhidden state, it will expand those hidden columns, I.E., all the month Columns appears.
Things to Remember
Grouping columns or rows in Excel is useful for creating and maintaining well-organized and well-structured financial sales data.
It is a better & superior alternative for hiding & unhiding cells; sometimes, it is not clear to the other Excel spreadsheet user if you use the hide option. He needs to track which columns or rows you have hidden & where you have hidden.
Before applying the grouping of columns or rows in Excel, You have to ensure that your structured data should not contain any hidden or blank rows & columns; otherwise, your data will be grouped incorrectly.
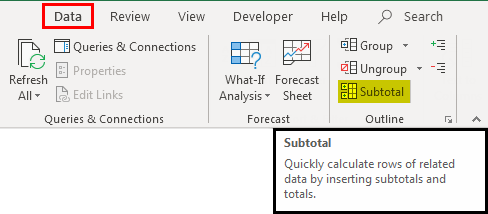
Apart from grouping, you can also summarize datasets in different groups with the help of the Subtotal command.
Recommended Articles
This has been a guide to Grouping Columns in Excel. Here we discussed How to Enable the Grouping of Columns in Excel, Examples, and a downloadable Excel template. You may also look at these useful functions in Excel –
