Updated July 26, 2023
Geometric Distribution Formula (Table of Contents)
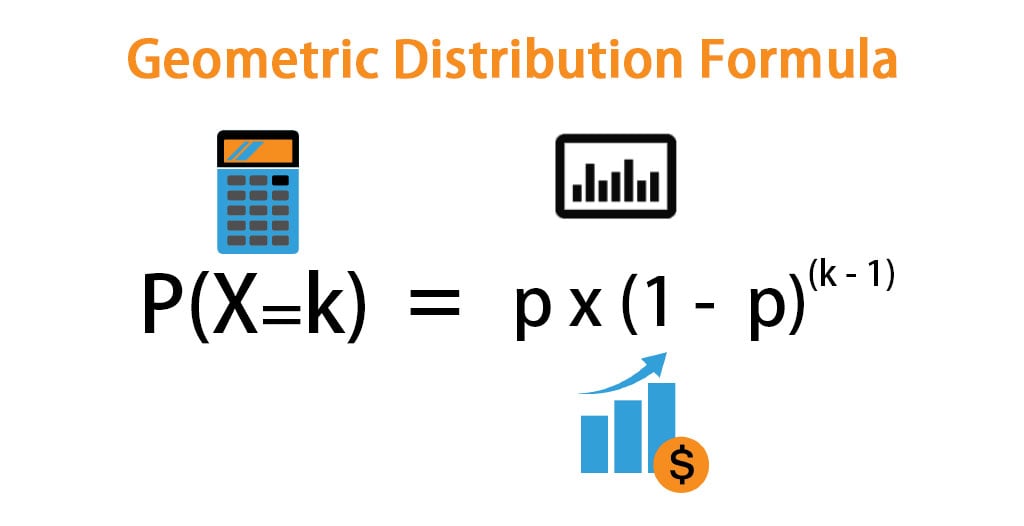
What is the Geometric Distribution Formula?
In statistics and probability theory, a random variable is said to have a geometric distribution only if its probability density function can be expressed as a function of the probability of success and the number of trials. In fact, the geometric distribution helps in the determination of the probability of the first occurrence of success after a certain number of trials given the success probability. If the success probability is ‘p’, then the formula for the probability of the first occurrence of success after ‘k’ trials can be derived by multiplying the success probability by one minus the success probability, which is raised to the power of a number of trials minus one. Mathematically, the probability density function is represented as,
Where,
- p = Probability of Success
- k = Trial at which the first success occurs
Examples of Geometric Distribution Formula (With Excel Template)
Let’s take an example to understand the calculation of Geometric Distribution in a better manner.
Geometric Distribution Formula – Example #1
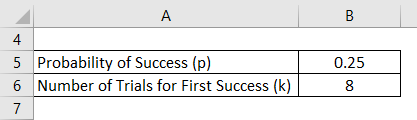
Let us take the example of a batsman who could not score off the first seven balls but hit a boundary of the 8th delivery he faced. If the probability of the batsman to hit a boundary is 0.25, then calculate the probability that the batsman to hit the first boundary after eight balls.
Solution:
Probability is calculated using the geometric distribution formula as given below.
P = p * (1 – p)(k – 1)
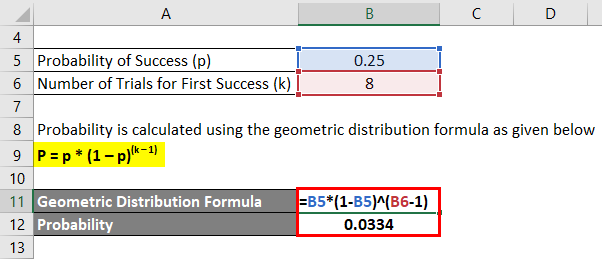
- Probability = 0.25 * (1 – 0.25)(8 – 1)
- Probability = 0.0334
Therefore, there is a 0.0334 probability that the batsman will hit the first boundary after eight balls.
Geometric Distribution Formula – Example #2
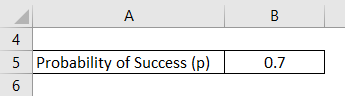
Now, let us move to the sports of football and take the example of a footballer who scores a goal with a probability of 0.7 whenever he gets the ball to himself. Determine the probability that the footballer will score his first goal after:
- 8 Attempts
- 6 Attempts
- 4 Attempts
- 2 Attempts
Solution:
8 Attempts
Probability is calculated using the geometric distribution formula as given below.
P = p * (1 – p)(k – 1)
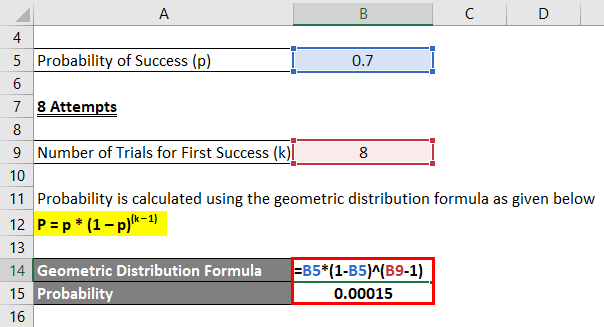
- Probability = 0.7 * (1 – 0.7)(8 – 1)
- Probability = 0.00015
6 Attempts
Probability is calculated using the geometric distribution formula as given below.
P = p * (1 – p)(k – 1)

- Probability = 0.7 * (1 – 0.7)(6 – 1)
- Probability = 0.0017
4 Attempts
Probability is calculated using the geometric distribution formula as given below.
P = p * (1 – p)(k – 1)

- Probability = 0.7 * (1 – 0.7)(4 – 1)
- Probability = 0.0189
2 Attempts
Probability is calculated using the geometric distribution formula as given below
P = p * (1 – p)(k – 1)
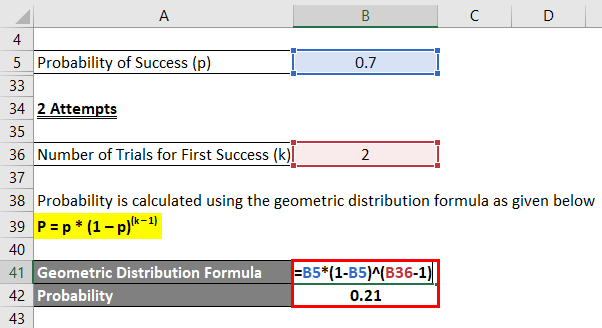
- Probability = 0.7 * (1 – 0.7)(2 – 1)
- Probability = 0.21
Therefore, in the above example, it can be seen that the probability of first success decreases with the increase in the number of failed attempts, i.e. the probability of first success declined from 0.21 after 2 attempts to 0.00015 after 8 attempts.
Explanation
The formula for geometric distribution is derived by using the following steps:
Step 1: Firstly, determine the probability of success of the event, and it is denoted by ‘p’.
Step 2: Next, therefore the probability of failure can be calculated as (1 – p).
Step 3: Next, determine the number of trials at which the first instance of success is recorded, or the probability of success equals one. The number of trials is denoted by ‘k’.
Step 4: Finally, the formula for probability of first success after ‘k’ trials can be derived by first calculating the probable failures, i.e. (1 – p), raised to the number of failed attempts before the first success, i.e. (k – 1), and then multiplying the result to the success in the kth attempt as shown below.
P(X=k) = p * (1 – p)(k – 1)
Relevance and Use of Geometric Distribution Formula
The concept of geometric distribution finds application in the determination of the probability of first success after a certain number of attempts. In fact, the geometric distribution model is a special case of the negative binomial distribution, and it is applicable only for those sequences of independent trials where only two outcomes are possible in each trial. It is to be noted that, as per this distribution model, with every increase in the number of failed attempts, there is a significant reduction in the probability of first success. In such cases, the distribution can be used to determine the number of failures before the first success.
Geometric Distribution Formula Calculator
You can use the following Geometric Distribution Calculator
| p | |
| k | |
| P(X=k) | |
| P(X=k) = | p * (1 - p) (k-1) |
| = | 0 * (1 - 0)(0-1) = 0 |
Recommended Articles
This is a guide to the Geometric Distribution Formula. Here we discuss How to Calculate Geometric Distribution along with practical examples. We also provide a Geometric Distribution Calculator with a downloadable Excel template. You may also look at the following articles to learn more –
