
How to Create Effective Gantt Chart for a Project?
Project management is a complicated process that often involves juggling several tasks simultaneously. It is true of all kinds of projects—managing a home, a challenging software development project, or a civil contractor.
When there are one or two tasks, it is easy for a project manager to remember what is to be done, when, and how. But what if there are multiple strands of activities, some interconnected? How does one keep track of all tasks to ensure that the project is completed well and completed well in time?
Here’s where the Gantt chart comes into the picture. They are a visual representation of the tasks in a project. The Gantt chart originated in 1896 when a Polish engineer, Karol Adamiecki, used a similar chart to depict production schedules. He called it the harmonogram, which remained largely unknown since its publishing in Polish and Russian. Concurrently, an American called Henry Gantt designed a similar chart, and it is his name that the chart now bears.
Production engineering used the chart extensively. Soon, with the advent of computers, it became a standard and practical project scheduling method. The Gantt chart for a project gained popularity with web-based applications and is now a standard feature in most projects. However, with Agile methodologies, the popularity of the Gantt chart could be higher. It has, however, tried to evolve with the times.
What is a Gantt Chart in Project Management?
First things first: What is a Gantt chart in project management? Simply put, a Gantt chart is a visual bar graph representation of a project’s schedule.
Typically, the rows comprise different project tasks, often drilling down to individual lessons, with the timeline forming the chart’s columns.
With programs that create a Gantt chart for a project, you can see where the project stands on any given day. It shows who is responsible for each task and any dependencies between tasks.
Here is a typical Gantt chart for a project:
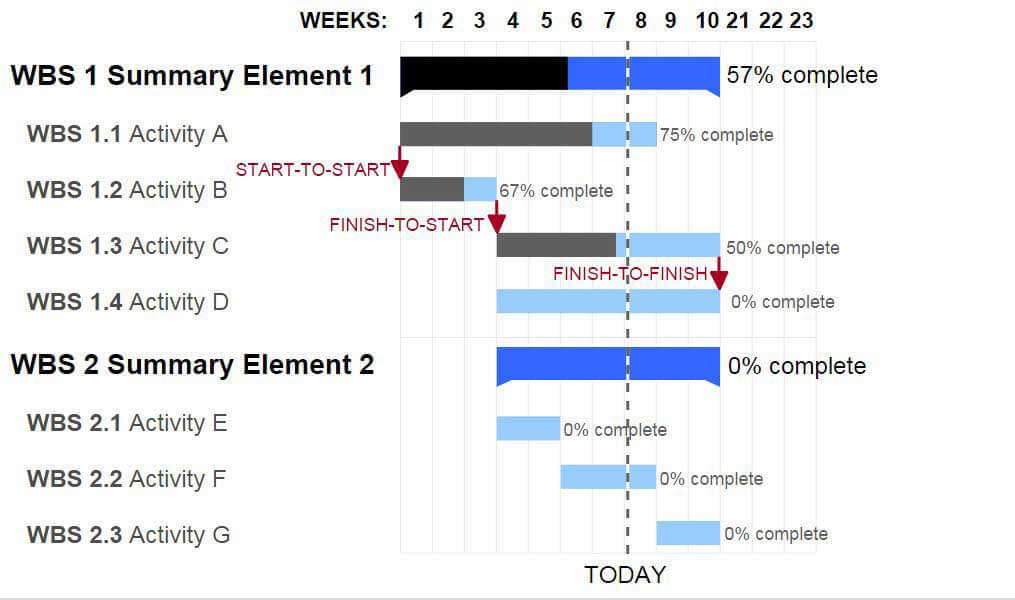
The chart clearly shows, in an easy-to-understand manner, where the project stands today. The chart is extremely useful in presentations to management and clients who may want a quick appraisal of the tasks underway.
Dependencies in Gantt Chart for a Project
One of the significant reasons that project schedules go awry is improper recognition of dependencies. Let us say you have a project that requires three distinct work paths. All these need to converge for the project to move ahead. Even if there is a delay in one of the work paths, the entire project schedule collapses. With a Gantt chart, this dependency is visually identified right at the planning stage, so any lag will be flagged instantly to denote possible delays. As a project manager, you can immediately deploy resources to ensure the delay causes minimum damage.
There are several types of dependencies in a project. One can denote all of these on a Gantt chart.
- Finish to Start (FS): Complete Task A before beginning Task B can begin in this dependency type. For example, you are working on a web design project. Use the images only after the client approves the website can any Photoshop work on the photos occur.
- Start to Start (SS): Start Task A for Task B to begin in this dependency type. A simple example would be in the field of writing. A writer must have started to write a novel before beginning to edit parts of it.
- Finish to Finish (FF): In this dependency type, Complete task A before completing Task B. Let’s say you are working on a brochure. Complete The “creating text” task before the “designing brochure” task finishes. However, the design can start before the completion of the text, as is often done using dummy text.\
- Start to Finish (SF): In this rare dependency, Task A must start before Task B can finish. Apply it to a new position that requires filling. It may be essential that the outgoing employee train the new employee so that the employee leaving the organization can do so only after the new one joins duty. Note that this is strictly not a professional approach.
In software development, Microsoft recommends using the Finish Start schematic most often. It also discourages using the Start to Finish algorithm, which might mean endless delay and possible circular references in a workflow. However, use the Start to Finish dependency for just-in-time deployments.
Steps to Create an Effective Gantt Chart for a Project
The process of creating a Gantt chart for a project is quite intuitive. However, for best use, you must also plan for the chart.
While you can prepare the chart on paper or a computer, it will make the task more accessible if you have a Gantt chart template to plug in the information into. Most web-based collaboration tools include Gantt chart templates. There are also plenty of templates available for the same for Microsoft Excel.
1. Make a comprehensive task list.
This step involves breaking down the project into its Gantt chart components. It will work best if one can break it down into a hierarchical structure with task groups, under which tasks are laid out in greater detail.
For instance, let us consider the task of creating a new website
Some of the overall stages are:
- Review
- Scope
- Design
- Content
- Coding
- Testing
- Implementation and maintenance
Under each of these steps, there will be additional tasks. It is best to drill deep as much as possible to define tasks clearly.
For instance, considering the Content phase, the sub-tasks involved may be:
- Collation and review of a text
- Collation and review of graphic elements
- Creation/rewriting text
- Creating graphics elements (may include a photoshoot, etc.)
- Image editing
- Text editing
- Finalization of content
Or any other steps that may be relevant to your project.
Similarly, all seemingly trivial tasks need to be listed out.
2. List the dependencies of tasks.
Task dependencies need to be listed. A simple Excel sheet, or even a Word table, would suffice.
What are the steps that are dependent on others?
In our example, the content edit can only begin after the evaluation of existing content and the creation of new content, if necessary. Do Photoshopping after taking photographs.
It’s essential to note down dependencies so that Gantt chart planning becomes more accessible and tighter.
It also depends on your organization. If teams are smaller and resources scarce, it might make sense to plot your help and timeline them. If yours is a massive company with a vast resource pool, it may make sense first to create the timeline.
3. Create the timeline for the project
It is the meatiest part of the Gantt chart for managers who like getting dirty earlier.
Once the tasks are ready, upon creating a timeline —factor in weekends and public holidays.
On software such as SmartDraw, the Gantt chart for a project is created right after you input data on a user-friendly screen. But with other software or Excel templates, you might have to type in values on the Gantt charts spreadsheet.
As the Gantt chart is a tool to visualize the plan, the availability of specialized software should be less.
Timelines depend on the client, and if the client has definite time constraints, ensure you divide the time between tasks smartly.
This timeline is bound to change and is likely, not final, but try to make it as close to last as possible.
4. Allocate each task to a group or person
As a project manager, you must figure out the best way to make this work. Evaluate your team. Figure out who will work best for which task. Laying the project on a rough timeline in a notebook or software will also help you ensure no double-dipping of resources—required at two places simultaneously.
It might take some time, but it’s an important part that needs fixing.
Some of the questions that might help you peg the appropriate people are:
- Will this resource be good in a client-facing role?
- Is this resource capable of coordinating and cooperating with others?
- Will this resource be able to turn things around quickly?
- Is this resource better at multitasking or at doing one task in depth?
- When is this resource available? Allocate The tasks depending on whether your project is resource-critical or time-critical.
At this point, there also needs to be clarity on several things within your organization:
- Who signs off on the design? On text? On budgets?
- Ensuring that the person signing off on things has appropriate leeway is essential. If the content director, in charge of all content, is leaving on a planned trip abroad, ensure it’s factored into the timeline.
It will require some coordination with HR and other project managers, and embrace it.
Now, you can allocate individual resources or groups to tasks that have already been timelined and mapped for dependencies.
So this should be it. One more final and crucial step remains.
5. Share and refine
After everything is locked in place, share the chart with critical stakeholders. It is a good practice to share the chart with your entire team to ensure you have caught everything necessary.
It is ready to be shared with the client, and after approval, your Gantt chart for a project is ready for use!
Limitations of the Gantt chart for a Project
The buzzword in software project management is Agile. Agile methodologies are everywhere, and their adoption is increasing by the day.
A traditional Gantt chart for a project is very limited in scope for modern software projects, as the focus is on adaptability. The Gantt chart plans the entire upfront, and if (instead, when) schedules change, they become tough to deal with. And time better spent is used to update the Gantt chart.
Agile projects may use short sprints (in the case of Scrum) or work on the most urgent job first (as in Kanban); preparing a Gantt chart for weeks will not be possible. In other responsive project methodologies such as Extreme Programming, it will merely be a waste of time, as the plannable portions of the chart are concise.
Software project managers have reported some success in using a Gantt chart for a project to keep track of individual sprints. Others pooh-pooh the idea, saying that a Gantt chart for project bases itself on the Waterfall project management model.
Gantt charts also have a reputation for trying to display less information. The bars, with varied colors to indicate different resources and dependencies, could be more straightforward for complex projects.
However, the Gantt chart is still a popular scheduling tool in several industries. They play a huge role in more process-driven projects such as website development.
Alternatives to Gantt chart for a Project
The Gantt chart is a bar diagram of task schedules. Any piece of paper, including a detailed to-do list, can achieve the same purpose.
Some alternatives to the Gantt chart for a project include:
- A detailed to-do list of persons responsible
- A whiteboard tracking the progress of each story/sprint, in the case of Agile projects
- A Kanban board: a simple board with three columns—to-do, doing, and done, in its simplest form
- Other tools explicitly created for Agile projects, such as Sandglaz
Gantt charts have come a long way, having served the manufacturing and service industries. They have made processes much more transparent and adapted as best they could for the more demanding software industry.
While their popularity has, no doubt, waned considerably, they remain the first go-to for project managers worldwide at the start of a project.
Recommended Articles
This has been a guide to how to create a Gantt chart for a project?. Here we have discussed steps to create a Gantt chart for a project in an effective manner, limitations, along with some alternatives to the Gantt chart. You may also have a look at the following articles to learn more –
