Updated June 8, 2023
Frequency Formula in Excel
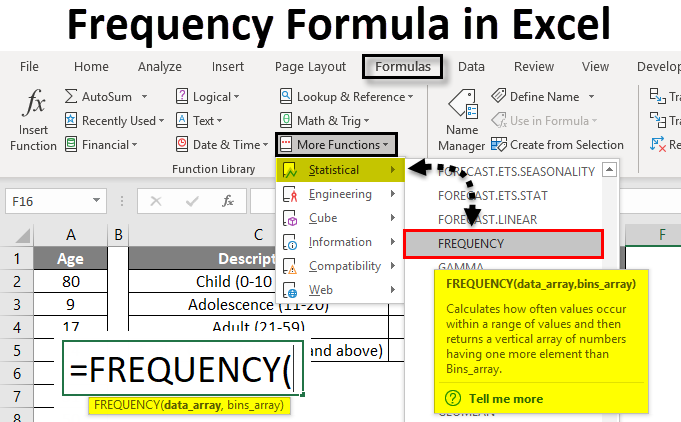
The FREQUENCY formula is a prebuilt integrated function categorized under a STATISTICAL group of formulas in Excel.
It’s a statistical calculation that lets you know how many times a specific value falls within a specific range, e.g., Suppose a table contains multiple age groups of people. We can group them based on the age parameter, i.e., Age grouping (frequency of appearance for Different age groups i.e.
- Child (0-12 years),
- Adolescence (13-18)
- Adult (19-59)
- Senior Citizen (60 years and above)
The frequency formula in Excel calculates or determines the Dataset’s frequency distribution, i.e., how many times that value appears within its range of values.
Definition of Frequency formula in Excel
- The frequency formula calculates or determines the supplied vertical array’s frequency distribution based on the Bins or intervals we supply.
- The frequency formula counts the values in a range of Excel cells or arrays that fall within a range or bin.
The syntax for the Frequency formula in Microsoft Excel is as follows:
The Frequency Formula in Excel has two arguments which are as below:
- Data Array: An actual range or array value is where you need to find out Dataset’s frequency distribution.
- Bins Array: A range or array of intervals (BINS) for grouping values.
The frequency formula should be entered as an array formula for multiple frequencies. If we want to find out multiple Bins or return multiple frequency values, it should be entered as an array formula with the CTRL +SHIFT +ENTER option in Excel.
How to Use Frequency Formula in Excel?
Frequency Formula in Excel is very simple and easy to use. Let’s understand the working of the Frequency Formula in Excel with some examples.
Example #1 – To find out a single Frequency in Excel
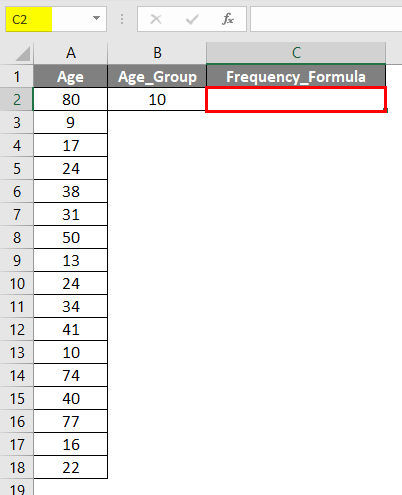
In the below-mentioned example, the Table contains a different number of age group entities. I need to determine the frequency of the age group under or equal to 10 years. Here Frequency formula counts how often values occur in a range or array in Excel.
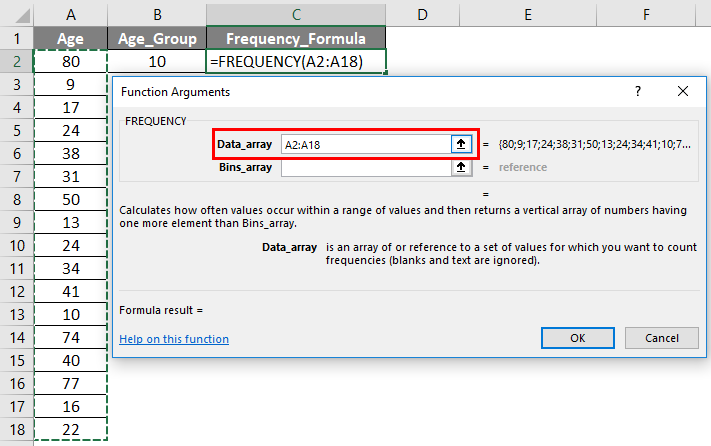
- Now, Let’s apply the frequency formula in cell C2. Select cell C2 where the frequency formula needs to be applied.
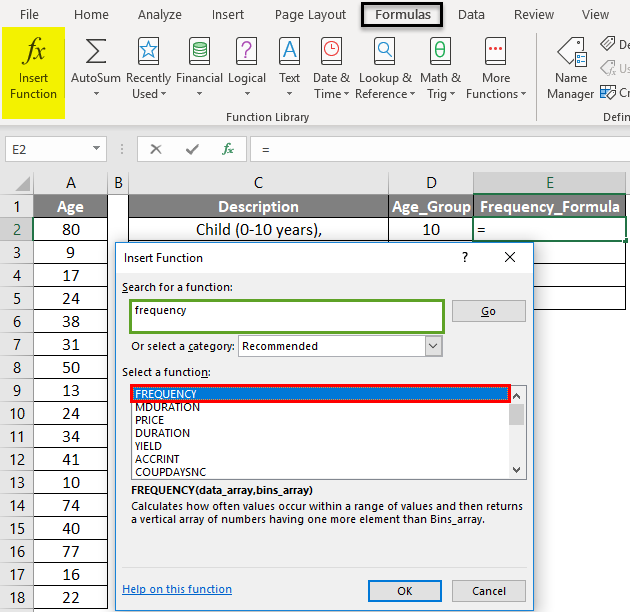
- Click the insert function (fx) button under the formula toolbar; a dialog box will appear, Type the keyword frequency in the Search for a Function box; the frequency will appear in the Select a Function box. Double click on the Frequency function.
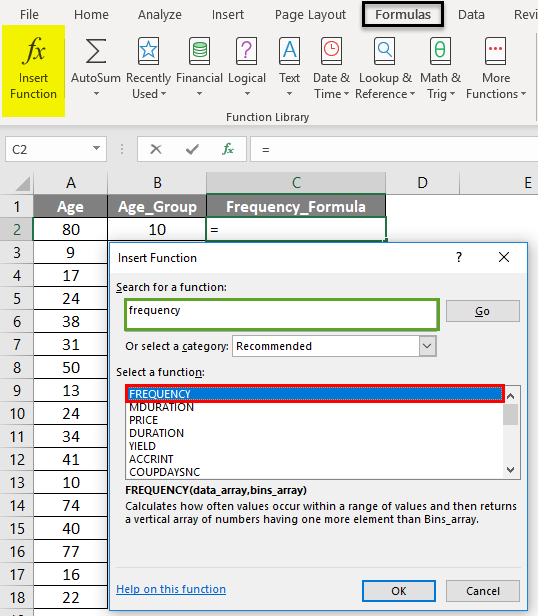
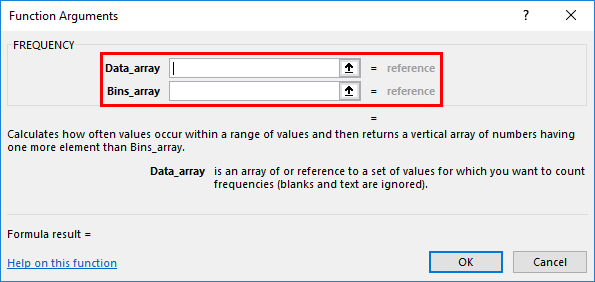
- A dialog box appears where arguments for the frequency function need to be filled or entered. i.e. =FREQUENCY (data_array, bins_array)

- Data Array: It is an actual range or array value where you need to find out Dataset’s frequency distribution; here, the range or array is from A2 to A18, So select the column range. i.e. A2:A18.
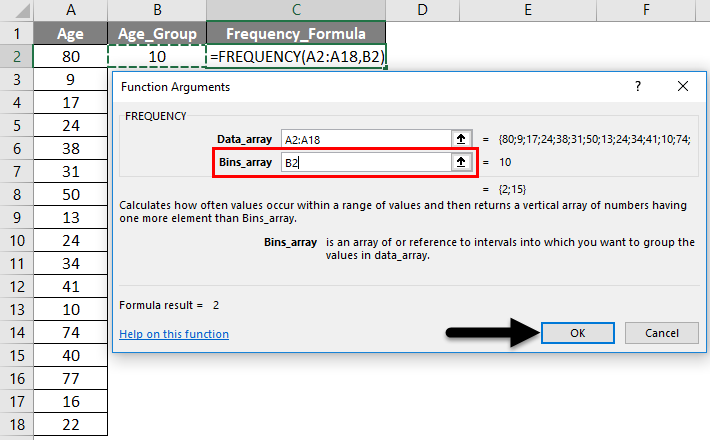
- Bins Array: A reference or range or array of intervals (“BINS”) for grouping values.
As we want to find a single frequency here. I need to find out the frequency of the age group under or equal to 10 years only here; therefore, we need to enter cell ref or age as 10 or B2. Click ok after entering the two arguments. =FREQUENCY (A2:A18,B2)
So the output will be as given below.
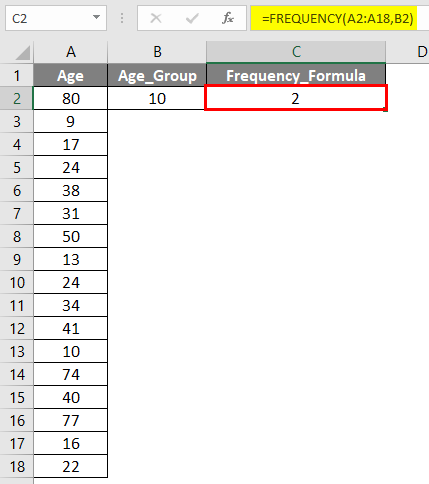
You can observe that the frequency Excel formula found 2 values or members where their age is less than or equal to 10 years of age in the above single frequency calculation. (Age > or = 10 years)
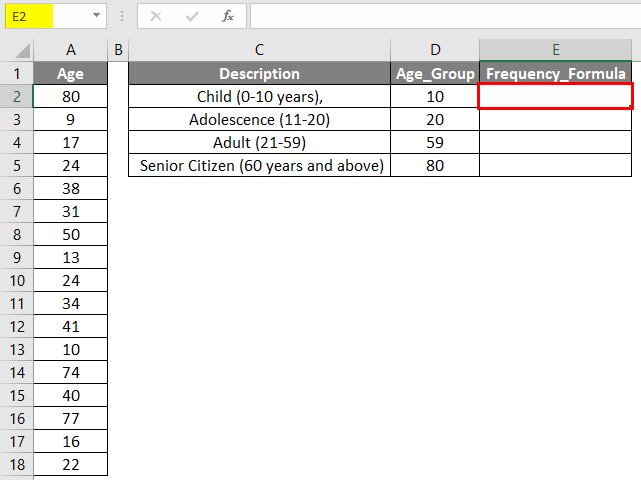
Example #2 – To Find Multiple Frequency in a date range
In the below-mentioned example, the Table contains a member with different age entities. I need to determine or calculate the frequency distribution of different age groups of 17 members aged between 9 and 80.
- Now, Let’s apply the frequency formula in cell E2. Select cell E2 where the frequency formula needs to be applied.
- Click the Insert Function (fx) button under the formula toolbar. A dialog box will appear, Type the keyword frequency in the Search for a Function box, and the frequency will appear in the Select a Function box. Double click on the Frequency function.
- A dialog box appears where arguments for the frequency function need to be filled or entered. i.e. =FREQUENCY (data_array, bins_array)
- Data_Array: It is an actual range or array value where you need to find out Dataset’s frequency distribution; here, the range or array is from A2 to A18, So select the column range. i.e. A2:A18.
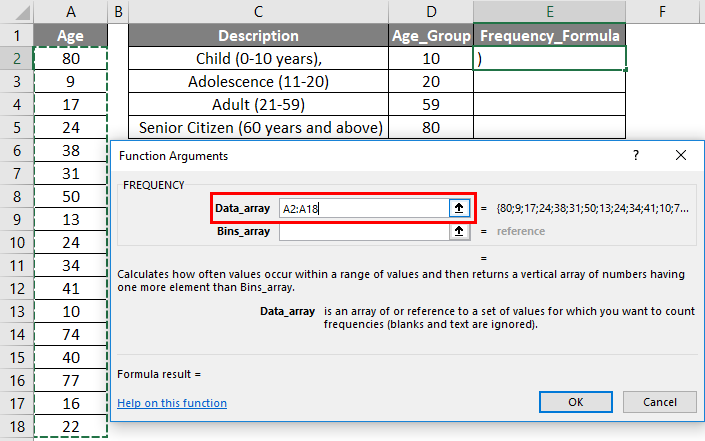
- Bins_Array: A reference or range or array of intervals (BINS) for grouping values.
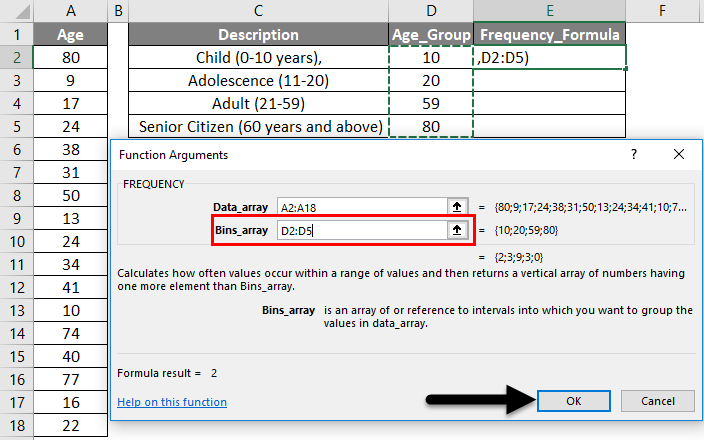
As we want to find out multiple frequency values here. I need to find out the frequency distribution of four different age groups here; therefore, we need to enter four bins array values, So that the four bins array values or range will get selected, i.e., D2:D5. Click ok after entering the two arguments. FREQUENCY(A2:A18,D2:D5)
The result will be as given below.

Now, you can observe that only the first cell of the Frequency column has a value; the rest are blank.
Select a cell range from E2 to E5 to obtain the other values. Once it is selected, Click inside the dataset of the frequency formula bar. Now, you can see all three ranges of values get selected in three different colors; press CTRL + SHIFT + ENTER for the array formula to apply.
Now, you can see the frequency result column; it displays all the missing values.
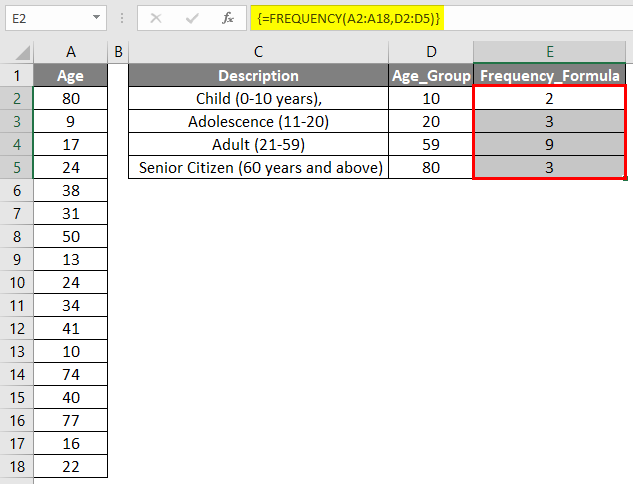
In the formula toolbar, you can observe the curly brackets for an array formula.
Things to Remember
- Frequency Formula ignores blank cells or text values in Excel.
- If the Data_Array argument in the frequency formula does not contain any values in an array or range of cells, then Frequency returns an array of zeros.
- If the Bin_Array argument in the frequency formula does not contain any values in an array or range of cells, then Frequency returns the number of elements in the data_array.
Recommended Articles
This has been a guide to Frequency Formula in Excel. Here we discuss how to use Frequency Formula in Excel, practical examples, and a downloadable Excel template. You can also go through our other suggested articles –
