Updated August 23, 2023
FREQUENCY Function in Excel(Table of Contents)
FREQUENCY in Excel
The frequency function in Excel is used to calculate how many times a number is getting repeated, in other words, we can say it calculates the occurrence of any number from the selected range of the bin table. If we see the syntax of the Frequency function, we will have a data array and bin array, whereas the data array is the complete range of data available, and the bin array is the number whose frequency we need to calculate.
What is the FREQUENCY function in Excel?
The FREQUENCY function returns how often values occur within a set of data. It returns a vertical array of numbers.
If you have age data for a group of children, you want to count how many children fall under different age ranges. Or you have the data of a school student and want to see how many students have achieved a grade of ‘A’, ‘B’, ‘C’ etc. For the above problems, we could use the FREQUENCY function in Excel.
FREQUENCY Formula in Excel
Below is the FREQUENCY Formula in Excel :
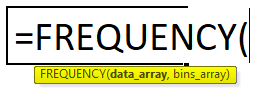
The FREQUENCY Function has two arguments as below:
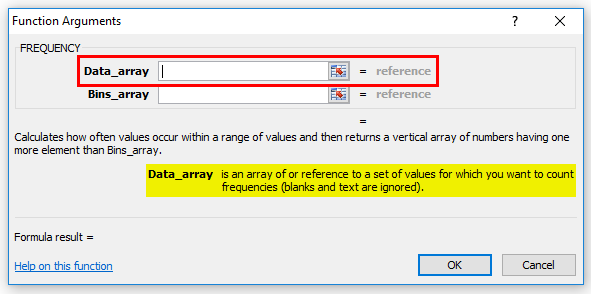
- Data_array – An array or set of values for which you want to count frequencies.
- Bins_array – An array of intervals (“bins”) for grouping values.
FREQUENCY counts how many times values occur in a dataset. This function has a special characteristic, and its usage differs from other formulas. While applying the FREQUENCY Function within a cell, type the formula and press CTRL+ SHIFT+ ENTER. This creates {} brackets around the formula, which Excel interprets as an array formula. If you simply press ENTER key, then this may return an incorrect result.
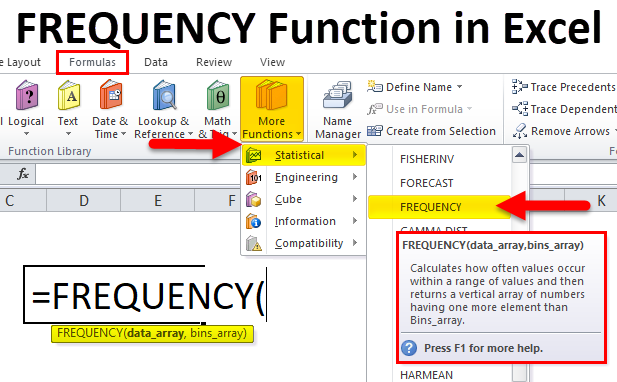
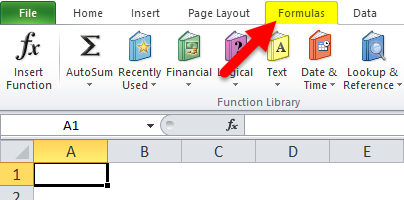
As FREQUENCY Function comes under the Statistical functions category, it is found under the FORMULAS tab. Please follow the below steps:
- Click on the FORMULAS tab.
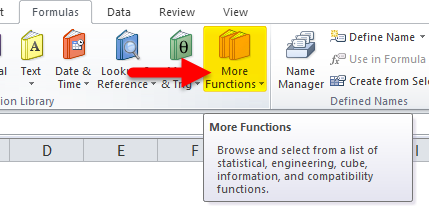
- Select the More Functions option.
- Click On the Statistical category.
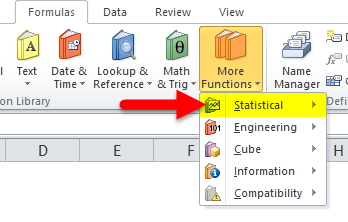
- Please select the FREQUENCY Function from the drop-down listed item per the screenshot below.
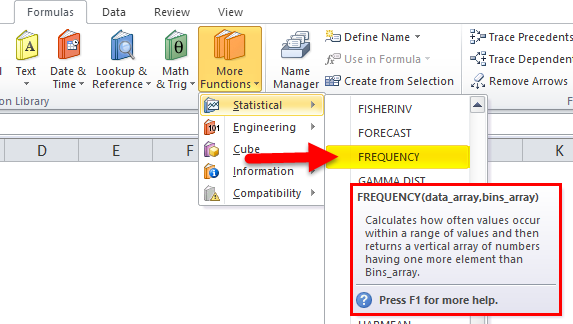
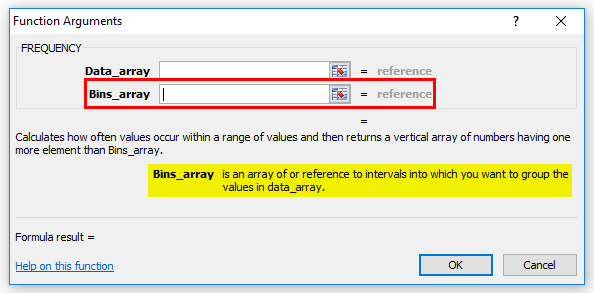
- After clicking on the FREQUENCY function, it will open a pop-up box for Function Arguments.
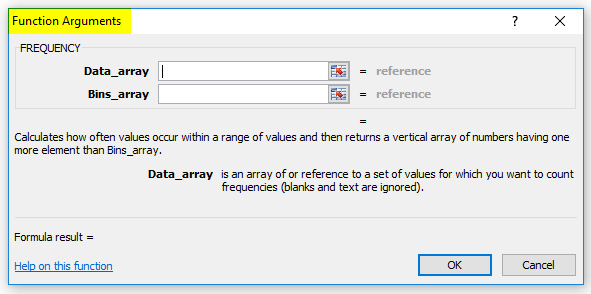
- Enter the Data_array, for which you want to count the frequencies.
- Enter the Bin_array, for which you want to group the values in data_array.
How to Use FREQUENCY Function in Excel?
The FREQUENCY Function in Excel is very simple and easy to use. Let us understand the working of the FREQUENCY Function in Excel by some FREQUENCY Formula examples.
Example #1
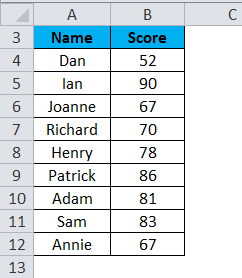
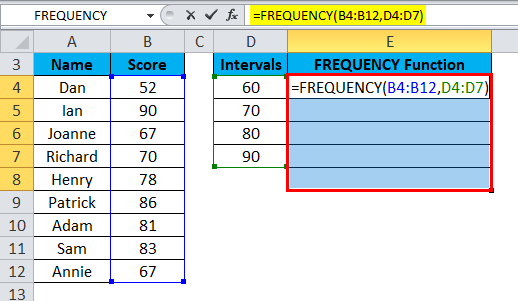
We have below some test scores:
According to the below intervals, we will apply the FREQUENCY formula.
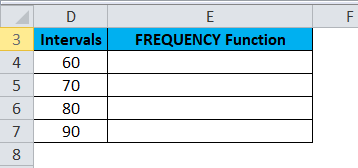
The interval field is the second argument of the FREQUENCY Function Bins_array, which specifies the maximum values for the score ranges. This means the score is to be split into 0—60, 61-70, 71-80, 81-90 and 90+.
First, select the cells where we want to apply the FREQUENCY formula.
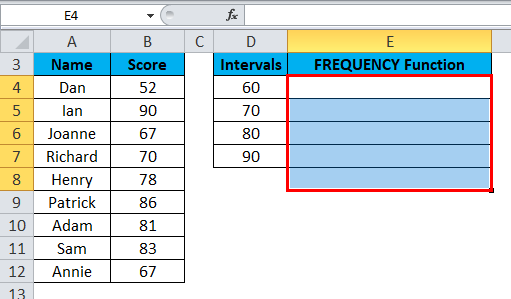
The Excel formula {=FREQUENCY(B4:B12, D4:D8)} into cells E4:E8 using CTRL+SHIFT+ENTER to complete the formula. This would give a vertical array with 5 values, as below screenshot:
The final result is shown below:
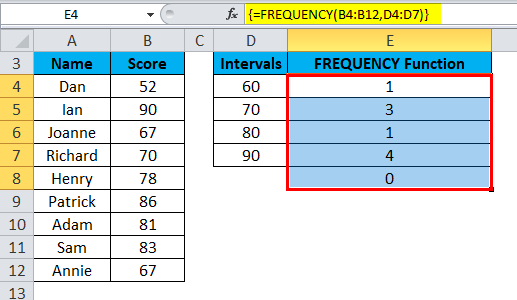
Explanation:
- The first value will display in cell E4. The result would be 1 because only 1 test score <=60.
- The second value is 3 because there are 3 test scores between 61 and 70.
- The third value is 1 because there is only 1 test score between 71 and 80.
- The Fourth value is 4 because there is 4 test score between 81 and 90.
- Score 90+; there is no value.
Example #2
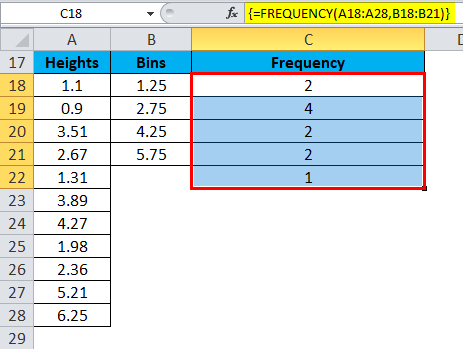
We can apply the FREQUENCY Function to decimal values also. Let’s take an example of the heights of 11 children (in centimeters).
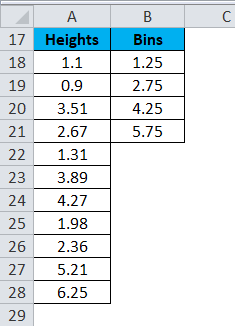
Now we need to calculate the frequency according to the specified Bins field. The FREQUENCY Function in cells C18:C22 is used to display the number of children whose height falls under the below ranges:
0.00-1.25 meter
1.26-2.75 meter
2.76-4.25 meter
4.26-5.75 meter
Over 5.76 meter
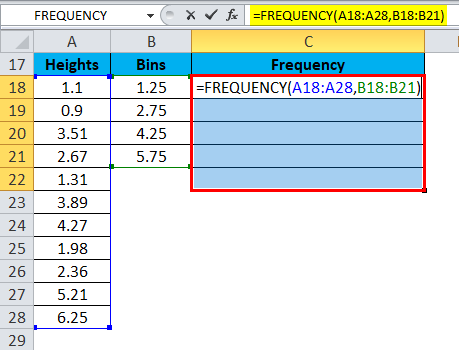
As shown in the above screenshot, the Formula used for the FREQUENCY distribution is:
{=FREQUENCY(A18:A28,B18:B21)}
The final result is :
Things to Remember
- First, you need to highlight or select the range of cells for the result of applying an array formula.
- Type the FREQUENCY Function into the first cell of the highlight range and press CTRL+SHIFT+ENTER.
- FREQUENCY Function in Excel returns an array of values; it must be entered as an array formula.
- Entering an array formula into too many cells can cause errors like #N/A. Only use the formula in the appropriate cells to avoid delays.
Recommended Articles
This has been a guide to FREQUENCY Function in Excel. Here we discuss the FREQUENCY Formula in Excel and how to use the FREQUENCY Function in Excel, practical examples, and a downloadable Excel template. You can also go through our other suggested articles –
