Updated August 5, 2023
What is Financial Modeling Color Coding?
Financial modeling color coding is when financial analysts use different colors to highlight important numbers and calculations to make their models easier to read and understand. For example, you can use green for profits, red for losses, black for formulas, yellow for estimates, etc.
Financial models are crucial for decision-making, but they can be complex, especially when they involve numerous calculations and formulas. So, to simplify the models, analysts use color coding to highlight essential elements like calculations, references, external links, etc., enabling users to grasp critical information quickly. It is similar to using highlighters in textbooks for emphasis.
Microsoft Excel is the best and simplest tool to create Financial models and use color formatting. This comprehensive guide will provide a stepwise demonstration of how to color code your financial models in Excel using our Tesla Financial model.
For instance, as you can see below, the impact of color coding on financial models.
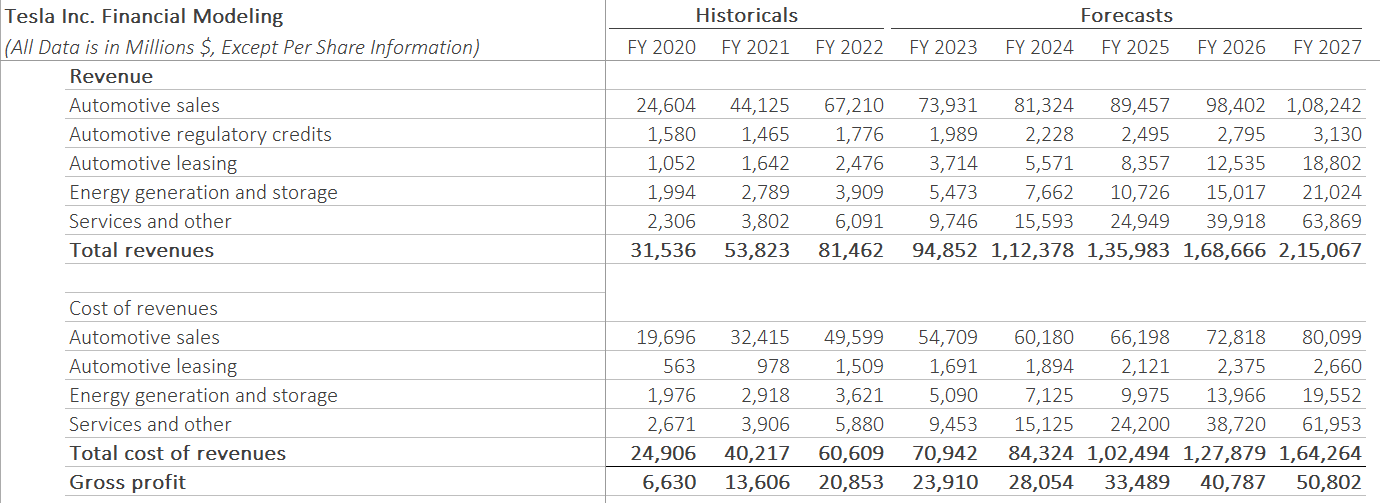
Before Color Formatting:
After Color Formatting:
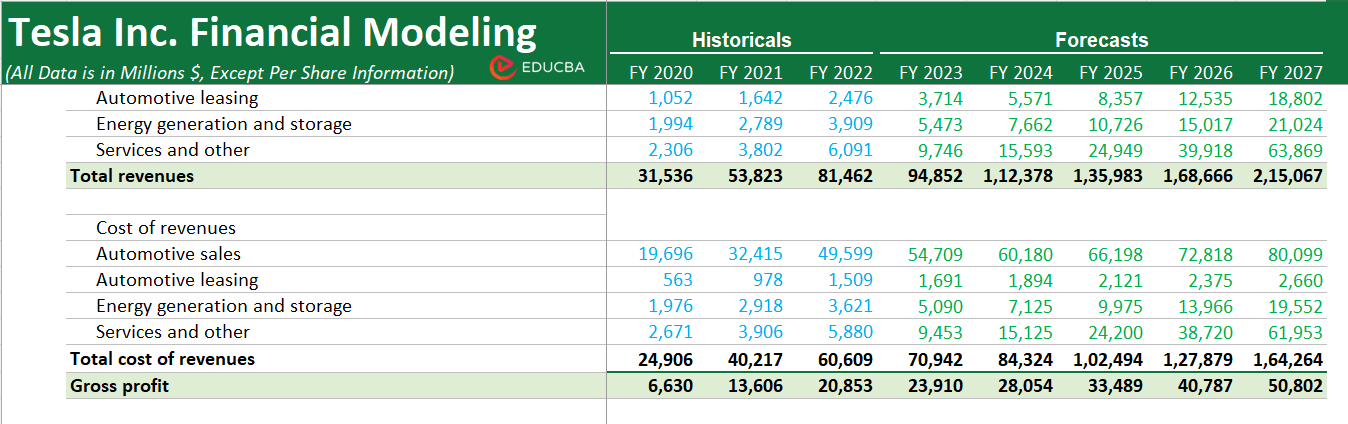
Table of Contents
Popular Color Coding Practices
Popularly in financial models, there are certain colors for specific purposes. The below table highlights the usage of different colors:
| Color | Used for | Meaning |
| Blue | Historical Data and Hard-coded numbers | Historical data represents information from past years, and hard-coded numbers are inputs that are unchangeable. |
| Black | Calculations and Cell References | Calculations are cells, where we have used formulas, and cell references, are when we add links within the same sheet. |
| Green | References to Other Sheets/Worksheets | Links to other parts of the model on different sheets or worksheets. |
| Red | External Links | External links refer to data outside the current model. |
 |
Assumptions/Estimates | Assumptions are data we use to predict future values, and estimates are predictions based on assumptions. |
Example:
At eduCBA, we use a consistent color formatting approach across all our financial modeling courses. For instance, we used the following color formatting scheme in our latest course on Tesla’s financial modeling.
Income Statement Projections of Tesla:
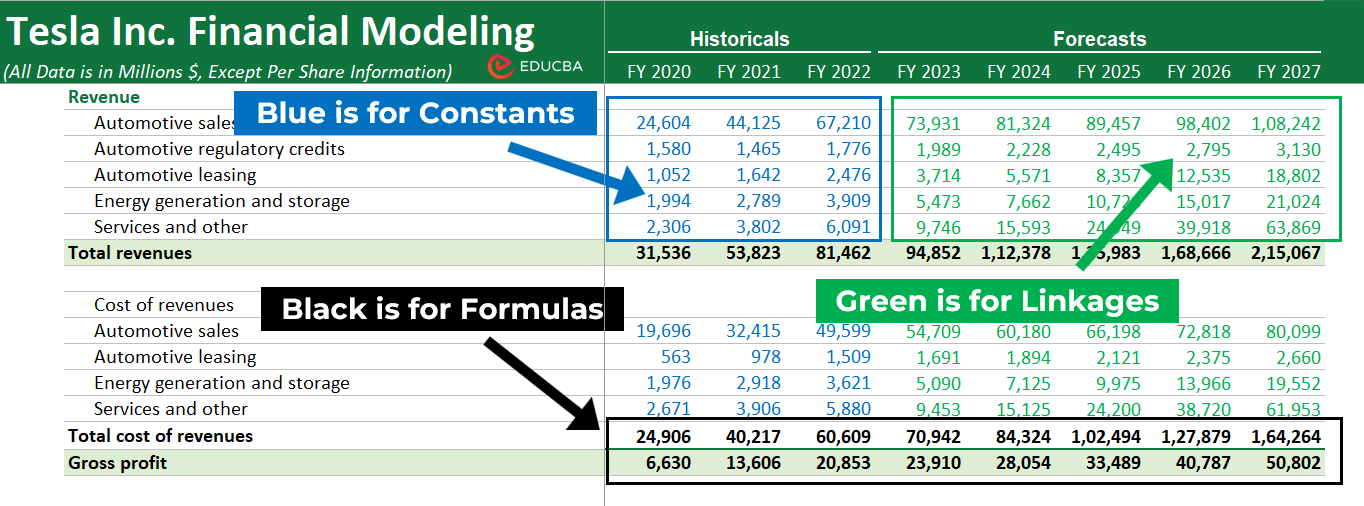
Image Source: eduCBA Financial Modeling Course 2023
Other Formatting Techniques
Along with color coding techniques, there are some additional formatting methods you can use to make the financial model simpler and more appealing.
| Formatting Technique | Use & Example |
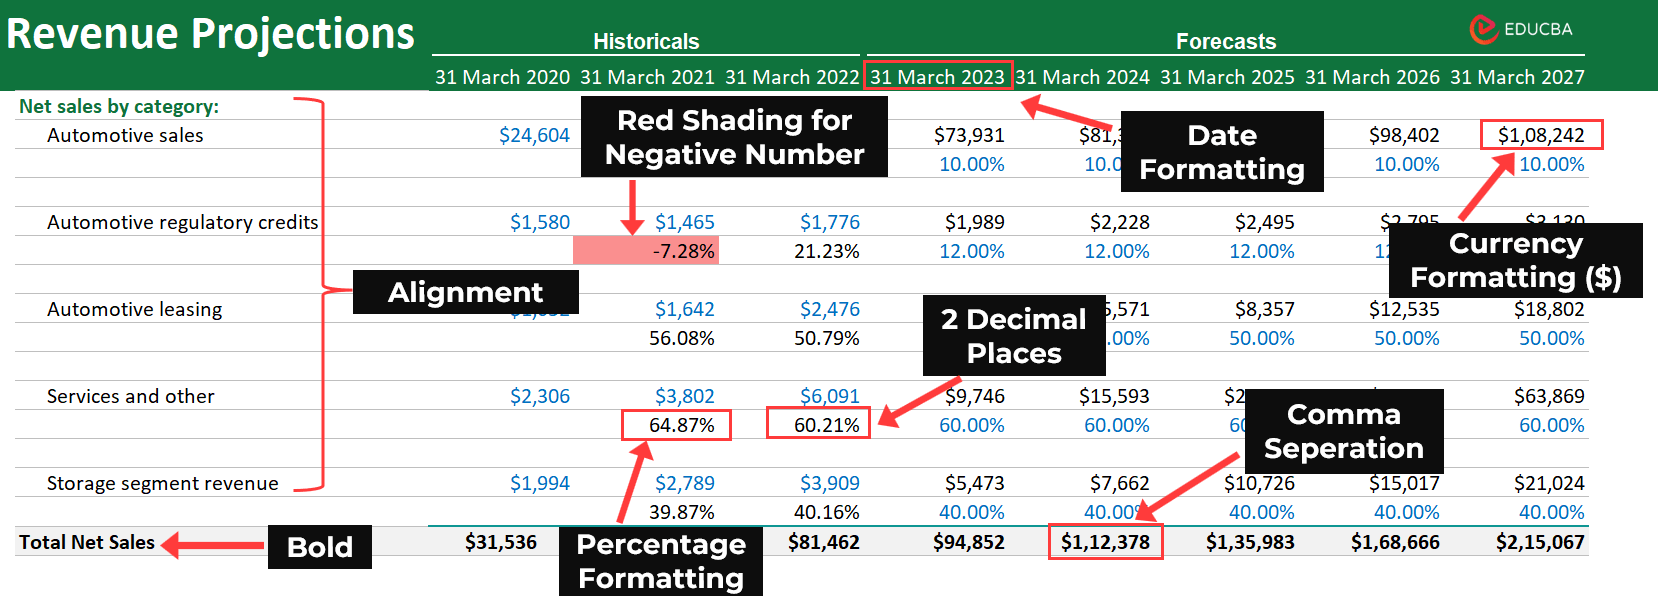
| Currency | To display monetary values in a standard currency format. Example: $6,294 |
| Percentage | To represent values as percentages. Example: 11.5% (instead of 0.115) |
| Decimal Places | To control the decimal accuracy of numbers. Example: 1.25 (2 decimal places) or 0.005 (3 decimal places) |
| Comma Separation | To enhance the readability of large numbers. Example: 2,000,000 (instead of 2000000) |
| Date | To display dates in a consistent manner. Example: 2023-09-01 or 01-Sep-2023 |
| Bold and Italics | To emphasize important information. Example: Revenue grew by 10% in Q1. |
| Cell Shading and Borders | To visually differentiate sections or highlight specific data. Example: Use green shading for positive values and red shading for negatives. |
| Alignment | To arrange data in a visually appealing manner. Example: Align currency symbols to the right of the cell for consistency. |
You can see below how we have used the above-given formatting techniques in our Tesla Financial model.
How to Apply Color Coding to Financial Models? – Stepwise Guide
You can apply color formatting to your financial model using either manual or automatic methods. Let’s explore the detailed steps for each approach.
Step 4: Set the condition parameters. For example, if you choose “Greater Than,” specify the value for the condition that will activate the formatting.
Step 5: After setting the condition, select the color you want to apply when the condition is met.
Step 6: Click “OK” to apply the conditional formatting.
Step 7: The selected cells will now have the chosen color based on the specified condition.
Step 8: You can add multiple conditional formatting rules to a cell or range by repeating steps 2 to 7.
Advanced Techniques and Customization Ideas
You can use several advanced formatting techniques to make your financial model stand out and make it more captivating and simpler.
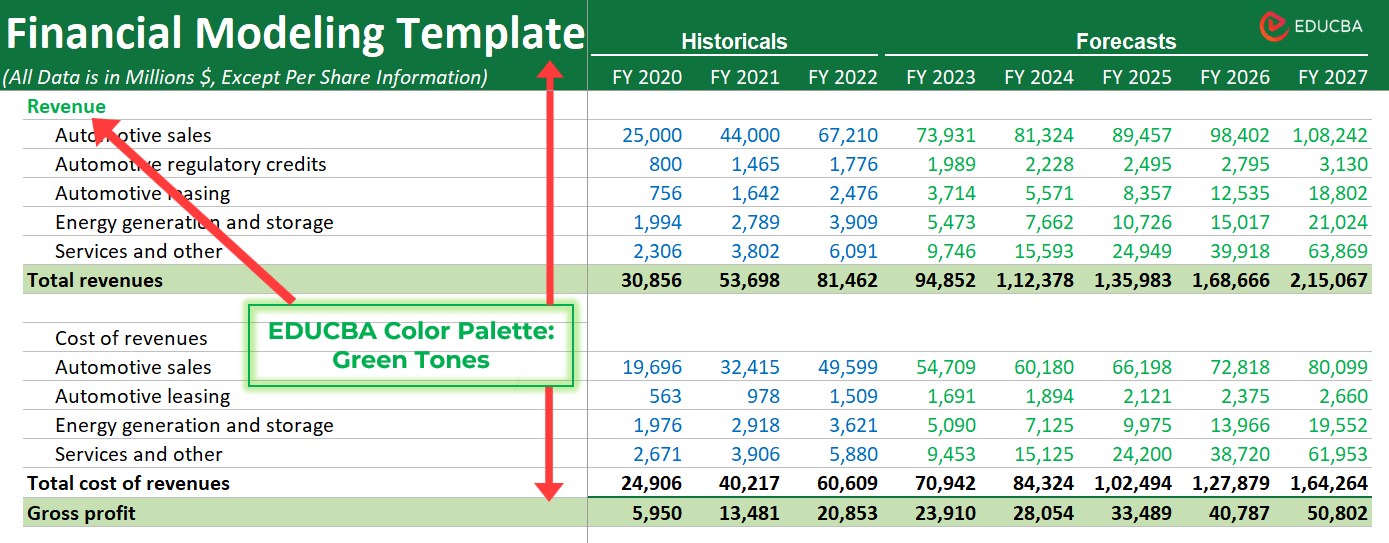
1. Custom Color Palettes
Use your brand colors as a custom color palette for your financial model to align it with your brand identity.
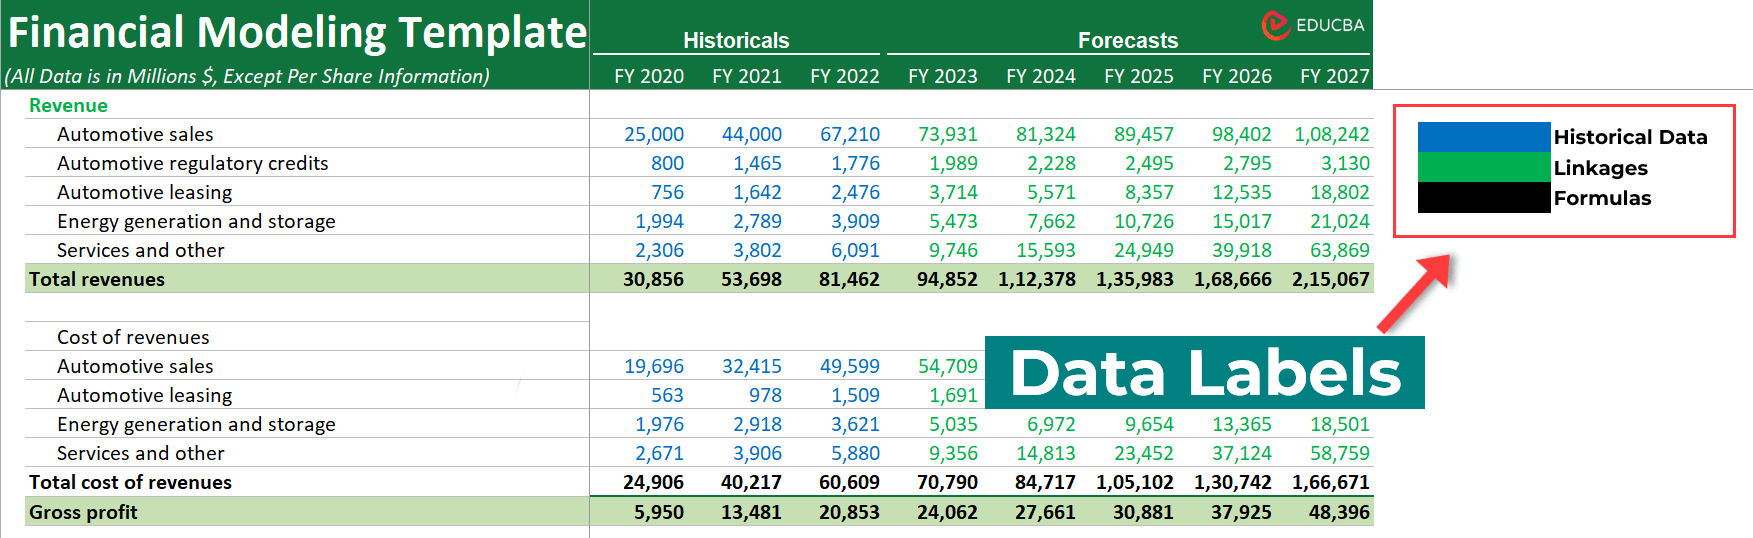
2. Data Labels
Add data labels to the model to ensure that users understand the meaning of different colors.
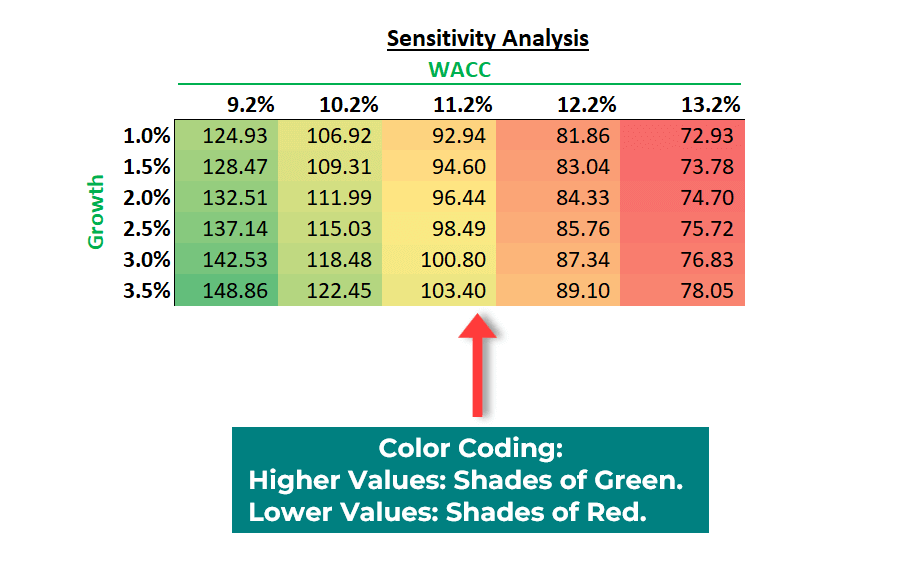
3. Color-Coded Scenario Analysis
Using different colors for different scenarios in sensitivity analysis can help you differentiate between each scenario’s outcomes.
4. Conditional Formatting with Icon Sets
In addition to color, you can use icon sets like arrows, shapes, and indicators (flags, exclamations, etc.) to provide a quick visual representation of trends.
For example, use arrows pointing up or down to indicate positive or negative growth rates.
![]()
Frequently Asked Questions (FAQs)
Q1. What is the best color scheme for financial modeling?
Answer: As per industry standards, most companies commonly use four colors: Blue, Black, Green, and Red. While you can use blue for inputs, encoded information like past values, assumptions, etc., use black for cells referencing other cells in the same sheet as well as any calculations. Moreover, highlight other sheet references in green and external links using the color red.
Q2. What are flags in a financial model?
Answer: Flags are indicators that come under icons set in conditional formatting. Financial modelers use flags in financial modeling to make it easier for users to identify and understand significant aspects of the model. For example, to bring attention to critical information or specific issues.
Q3. Is Excel the best tool for financial modeling color coding?
Answer: Yes, Excel is user-friendly and has several formatting tools and formulas. Thus, Excel is the easiest way to apply color formatting to financial models. You can also use other spreadsheet software like Google Sheets, Zoho Sheets, Quip, etc.
Recommended Articles
This article demonstrates how to use financial modeling color coding in Excel. It includes easy-understand images and provides step-by-step instructions for two methods to add color formatting to your financial models. For further details, you can refer to the following articles.
