Updated July 10, 2023
What is Financial Forecasting?
Financial forecasting evaluates a company’s past performance and the market’s current trends to predict its future financial performance. It’s a critical tool for businesses of all sizes, as it can help them make informed decisions. Thus, they gauge where to allocate resources and how to position the firm for growth best.
The four major components of financial forecasting are projected income statements, cash flow, balance sheet, and funding sources. Financial forecasting has several methods to calculate the fundamentals of financial indicators. Delphi, percent of sales, moving average, etc., are some methods.
Key Takeaways
- Financial forecasting is the estimation of a company’s future financial performance. It uses past performance records and present-day trends for the projection.
- It’s a crucial part of effective financial planning, as it helps make resource allocation decisions to achieve satisfactory financial results.
- Analysts create them using various quantitative and qualitative techniques. However, some popular methods include regression models, straight-line, market research, etc.
- While financial forecasting predicts future outcomes and business performances, financial planning uses that forecast to create functional and practical strategies.
How Does Financial Forecasting Work?
- In financial forecasting, businesses project their financial statements to predict the company’s future.
- Majorly, companies use the income statement for internal planning. However, they may use all the financial statements when the aim is to bring in investors.
- Financial forecasting primarily lays a clear picture of the company’s future position. Thus, management can use the estimation to create actionable schemes to achieve business goals.
- For instance, firms can project and forecast their cash flow statement to understand upcoming profits and losses.
Therefore, forecasting involves reflecting on data, numbers, and statistics. Those are the factors that have an impact on a company’s behavior over a specific period. Other factors, such as economic conditions and market trends, can also influence the forecast. Thus, financial forecasting involves assumptions as well to equip such unforeseen factors.
Components of Financial Forecasting
The primary financial statements and other funds are the fundamental and necessary elements of forecasting a company’s financials.
1. Profit and Loss Statement
- The profit or loss statement, commonly known as the income statement, is an essential forecasting component.
- It demonstrates how an organization generates profit or loss over a period.
- The profit or loss statement projection can foresee impending expenses and income. Budgets are also a large part of this statement’s projection.
- Moreover, items that can be forecasted in a P&L statement include revenue, COGS, operating expenses, depreciation, amortization, interest income, and interest expense.
2. Cash Flow Statement
- Every company relies on cash to run. The cash flow statement displays the total amount of money coming in, going out, and remaining at the end of the month.
- The company’s income statement may predict loss but not cash on hand. Thus, we project cash flow statements to determine how the company can operate while making timely adjustments to create profit cycles.
- A forecast of cash can help management plan on cash outflow for wages, debt payments, tax, etc. They can also use it to plan future investment strategies.
- Items that can be forecasted in a Cash Flow statement include cash flow from operating activities, cash flow from financing activities, cash flow from investing activities, and cash in hand.
3. Balance Sheet
- The balance sheet provides a summary of the company’s financial position. It consists of assets like cash on hand, money in the bank, etc.
- It also includes shares, investor stocks, and shareholders’ equity.
- Within liabilities, it contains unpaid bills, loan fees, credit card balances, and other obligations.
- It uses various financial inputs like profit, investment, financial plans, and cash and capital expenditure budgets.
- Items forecasted in a Balance Sheet include long-term debt, retained earnings, Net PP&E, other liabilities, and much more.
4. Working Capital
- We project the additional funds using the projected balance sheet, income statement, and initial balance sheet. These funds used during the planning period are known as working capital.
- Firms use this projection to evaluate operating expenses like tax and dividend payments.
- Items forecasted in a Working Capital Schedule include accounts receivable, accounts payable, prepaid expenses, other current liabilities, etc.
How to Create a Financial Forecast?
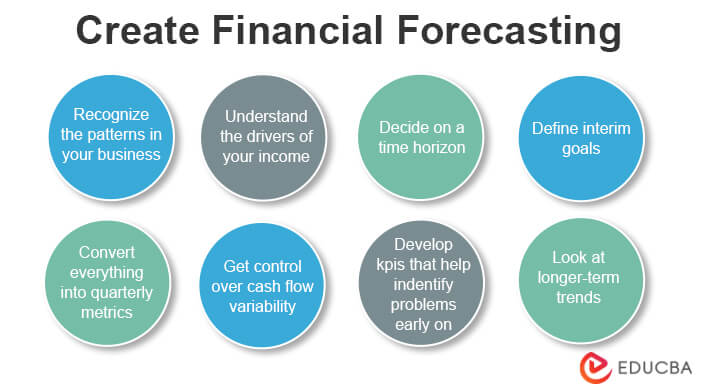
a) Determine the Purpose
- Determining its purpose is the first and foremost step in creating a financial forecast.
- Companies can forecast data for various reasons like analyzing budgets, evaluating products & services, and much more.
- For every objective, analysts need to use different factors of the business. Thus, working out a specific goal is necessary.
b) Gather Information
- After deciding the goal of financial forecasting, the management can establish the factors needed.
- Companies then gather data relevant to the subject of the forecast. For example, if they want to forecast revenue, they might need sales, expenses, etc.
- Analysts collect details from current financials as well as historical data of the company.
- They must also ensure they possess all necessary data; otherwise, forecasts might be inaccurate.
c) Choose a Method
- We can create financial forecasts using a variety of techniques. These techniques can be quantitative as well as qualitative.
- Some widely available and applicable methods include moving averages, regression analysis, straight-line, market research, etc.
- Every process has a different focus and provides specific results.
- Thus, selecting a way that best suits the company’s needs is critical.
d) Project the Information
- After we decide on the method, we can project all the information.
- Analysts project the financial statements as per the requirement.
- They project revenue, income, cash flow, assets, liabilities, etc.
- It is crucial to project data as it directly affects the forecast precisely.
e) Monitor & Forecast
- After the projection of all available data, analysts prepare the forecast.
- However, as information is subject to change, they must monitor the forecast monthly.
- The forecast has to be up to date with all changes that transpired internally or externally.
- Access to crucial data can help with making business decisions.
- Therefore, with the help of these forecasts, you can plan strategically, buy the equipment you’ll need, and hire more staff to support your company’s growth.
- Using the estimates, the financial department can identify the areas that need improvement.
Examples
Download the Excel template here – Financial Forecasting Excel Template
Example:
Let us see an example using the percent of sales method.
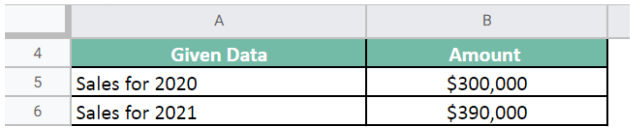
Company ABC produces stationery items. As notebooks are their prominent product, they want to forecast the next year’s sales. The given data is,
Sales for year 2020 = $300,000;
Sales for year 2021 = $390,000;
Forecast the next year’s sales for the notebook.
Given.
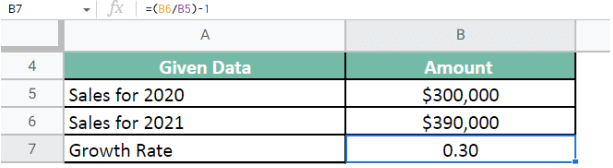
First, we need to calculate the growth rate for Sales.
Formula: Growth Rate = (Sales for 2021 / Sales for 2020) – 1
Next, we calculate the future sales forecast.
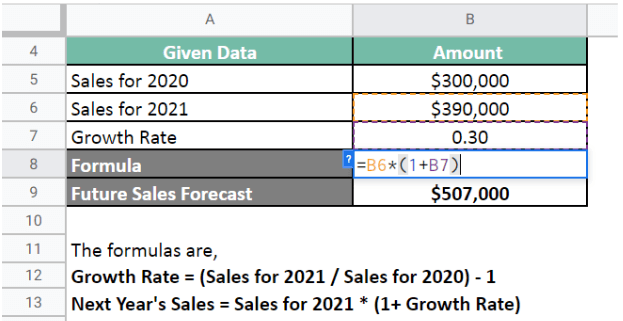
Therefore, we determine next year’s sales forecast using the percent of sales method.
Sales for 2022 = $507,000
Financial Forecasting Methods
Quantitative Research
The quantitative approach employs questions to gather quantifiable data for statistical analysis. It extrapolates the findings from a sample to the entire population using techniques and statistical inference. In simple terms, it researches numerical or quantitative variables. Some quantitative methods are regression analysis, percentage of sales, moving average, and the straight-line method.
1. Percent of Sales
- This method calculates the percentage of sales using the line-of-sale items from the primary financial statements. They later apply these percentages to estimate those sales items’ future value.
- The companies need to analyze their history to establish the percentage of sales values. For instance, the selling price of a product is proportional to its production cost. Thus, we can apply a similar growth rate to future metrics.
2. Straight-Line Method
- The easiest and most popular method businesses use is the straight-line method. It involves assuming that the company’s growth rate stays constant. Thus, applying the growth rate to the current financials can present future values.
- However, this method does not consider fluctuations in the market and economic conditions. It also needs increasing experts and individuals to conduct financial calculations and economic operations with security.
- Here, we first calculate the growth rate using the company’s history. Then, we multiply the growth rate with the current data value and calculate the result.
3. Moving Average
- Moving averages is an effective visual tool that is easy to use and comprehend. It provides essential insights into company trends. It averages the company’s historical data and creates a future forecast.
- Moving averages’ most typical use is to determine the trend’s direction. For instance, sales for a particular product from the previous quarter can help predict the current quarter’s sales.
- Simple Moving Averages (SMA) and Exponential Moving Averages (EMA) are the most widely applied moving averages. Calculating the moving average is dividing the total variable value for a period by the number of periods.
4. Simple Linear Regression:
- Regression analysis enables us to determine which elements have the most significant influence on a particular business area. These elements are called variables, and they are dependent and independent variables.
- It is the most popular method for modeling a relationship between two sets of variables. Analysts produce an equation to forecast and estimate data.
- In this model, X-axis carries the independent variable, while the Y graphs the dependent variable. The observations of the Y variable at each level of X represent their relationship as a straight line.
- The simple linear regression equation is y=Bx-A, where y and x are the dependent and independent variables. B is the slope, and A is the intercept.
5. Multiple Linear Regression
- Multiple linear regression is a statistical method that examines situations where more than one variable is present. There can be several independent variables but only one dependent variable.
- Using this technique, one can check causes and approximately predict the values of the response (dependent) variables.
- A business is affected not only by a single situation but by many factors. Thus, this method is more dynamic and valuable, as it uses several variables.
Qualitative Research
The goal of qualitative research is to interpret the meaning of non-numerical data to understand social life better. To gather qualitative data and understand consumer behavior, qualitative researchers use a combination of focus groups, interviews, and observations. This type of research has a subjective view of the company’s performance. The methods under this research are market research and the Delphi method.
1. Market Research
- Businesses use market research to gather data to understand the consumer better systematically. The study helps in making better business decisions.
- It assists in understanding the needs of the market. The company can create effective planning of human and material resources to align with market trends.
- Surveys can help gain knowledge about the company’s target audience. They use it to understand customer needs regarding goods or services.
- Startups need to determine the economic degree of success or failure when it enters the market. Even when existing businesses launch a new product or service, they must gauge its success rates. Market analysis methods can help with both of these scenarios.
2. Delphi Method
- The most popular qualitative sales or demand forecasting technique is probably the Delphi Method. This approach involves a multi-stage, iterative process with a team of experts.
- This method uses professionals who have been in the market for a while. They must possess plenty of experience and knowledge of the industry’s demands.
- The analysts first analyze the business model and prepare a forecast. The report is circulated among the experts individually, where they add their opinion on the forecast.
Financial Forecasting vs Financial Planning
Financial Forecasting and Financial Planning are two significant concepts of finance. Both the terms are relative to a company’s future and impact a company’s financial future preparation. Yet, there are differences between the two. Financial forecasting focuses on predictions, while financial planning concerns long-term goals.
- Financial forecasting uses factors such as a company’s current cash position or industry trends to determine future happenings. However, most of what happens during a financial plan is future speculation based on present-day actions.
- Forecasting involves estimating using data from the company’s historical and past events. Therefore, financial planning considers savings and investments to plot a future financial outcome.
- Financial forecasting is a component of strategic planning, but it does not include implementation approaches. It generally facilitates statistics to guide planning. Financial Planners also, use present information to create an actionable plan for their clients.
- In financial planning, you’re considering how to sustain your company for years. Plans are usually less detailed than forecasts and span from one year to five years.
Benefits of Financial Forecasting
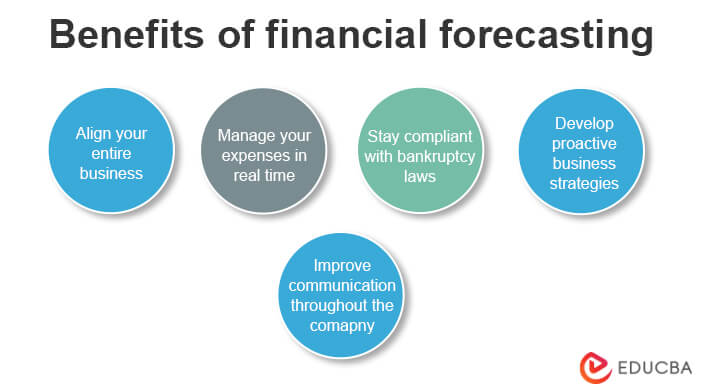
1. Align your Entire Business
- Businesses need to ensure that their finances are in order.
- Financial forecasting helps because it considers all major and minor economic factors.
- Overall knowledge about the businesses’ finances can be a valuable tool for strategic planning to align the corporation.
2. Manage your Expenses in Real Time
- Forecasts allow for making informed decisions daily to control cash flow effectively.
- Plus, analyzing past transactions using appropriate software tools can identify problematic areas with cash leakage.
3. Stay Compliant with Bankruptcy Laws
- When filing for bankruptcy, the court looks at the finances to decide eligibility. Therefore, companies should get help from a lawyer or accountant to comply with the law.
- Moreover, a solid understanding of the company’s finances is essential to meet regulatory requirements like an SEC filing or 10-K report.
- Financial forecasting software also makes it easy to handle all these tasks quickly and efficiently. Netsuite, Sage Intacct, and Workday are some software other than Excel.
4. Develop Proactive Business Strategies
- Financial forecasts make it easier to answer these questions by providing crucial information about future expectations, resources, investments, debt obligations, etc.
- Creating forecasts compels you to take stock of your current situation. Thus, creating opportunities for perceiving business goals with a new perspective.
- A robust forecast also allows you to answer what-if scenarios like rising interest rates or increasing costs.
5. Improve Communication Throughout the Company
- Without a clear understanding of where the company is financially, it cannot be easy to make informed decisions about its future.
- Therefore, by creating a financial forecast, you can ensure that everyone in the company is working towards the same goal.
Frequently Asked Questions(FAQs)
Q1. What is Financial Forecasting? Give an example.
Answer: Financial forecasting is an instrument that aids in future planning based on expected income, expenses, and investments. For instance, an analyst analyzing companies like Netflix, Amazon, IBM, and Starbucks by financial forecasting can help understand the respective companies’ future sales, expenses, Capex, Debt, and valuation.
It is an analysis that enables determining a company’s long-term growth rate from a financial standpoint. Therefore, this set of actions evaluates the performance and history of previous financials using projection.
Q2. What is the purpose of financial forecasting? Why is it important?
Answer: A financial forecast assesses the future course of a business or the entire economy. Its primary purpose is to help with business evaluations to lead to practical decision-making. Therefore, investors use these predictions to make better choices about investments.
They are also crucial for business planning, budgeting, operations, and funding. They even assist executives and external stakeholders in making wiser decisions. However, an economic forecast estimates how much money a company will make in the future, which can help create the annual budget.
Q3. How to create a financial forecast model for startups?
Answer: Even though startups do not have financial data available initially, they need forecasts to create their action plan. Thus, we can use qualitative methods to make financial forecasts for startups. Moreover, market research of the industry will help gain insight along with the Delphi method.
They can also forecast for another firm from the same industry and similar size. That way, they get an approximate idea of the market.
Q4. What are some financial forecasting methods?
Answer: There are different methods that analysts implement for the process of creating a financial forecast. They classify as qualitative and qualitative techniques. Some majorly effective ways are single & multiple linear regression, Delphi, multiple averages, percent of sales, etc.
Q5. What are some common financial forecasting mistakes?
Answer: Some of the most frequent financial forecasting mistakes are not updating the data regularly, ineffective communication, inaccurate interpretation of information, etc. However, analysts must correct forecasts over time because financial data is dynamic. Also, it might narrow the outcome when analysts predict data aligning it with the expected goals.
Recommended Articles
This article acts as a guide to Financial Forecasting. To learn more about Financial Forecasting, please read the following articles:
