Updated July 10, 2023
Forecasting Formula (Table of Contents)
What is the Forecasting Formula?
The forecasting formula, a statistical function primarily used in forecasting quantitative business variables ( generally Sales / Revenue, Profit, etc.), is used to forecast the future value based on the existing or given dataset.
Formula
Where,
- “x”: The number for which a forecast needs to be made.
- Known_y’s: The group or array of dependent data. It is required in the formula to proceed further.
- Known_x’s: The group or array of independent data is also mandatory for the results.
Types of Forecasting Formula
There are multiple formulas for Forecast in excel. For example, when we write =Forecast, a series of functions like Forecast appears in the forecast dropdown list, such as FORECAST.ETS, FORECAST.ETS.CONFIDENT, FORECAST.LINEAR. The widely used variant is FORECAST / LINEAR FORECAST. The formula of linear forecast helps find out the result when there is a linear or close to a linear pattern in the data given. The most popular forecast function is the Forecast in excel.
Example of Forecasting Formula (With Excel Template)
Let’s take an example better to understand the Forecasting Formula calculation in a better manner.
Forecasting Formula – Example #1
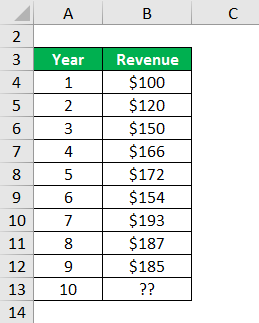
The following data has been taken from a grocery store in California. Find the forecasted data for the 10th year via the Excel Forecast function.
Solution:
The above data is given to us, which is complete as it contains the x, known_x, and known_y. So we can move ahead and calculate the forecasted data for the 10th year. Then, we will apply the formula in the cell corresponding to the 10th year or adjacent to the 10th year.
Forecasting is calculated using the formula given below
FORECAST(x, known_y’s, known_x’s)
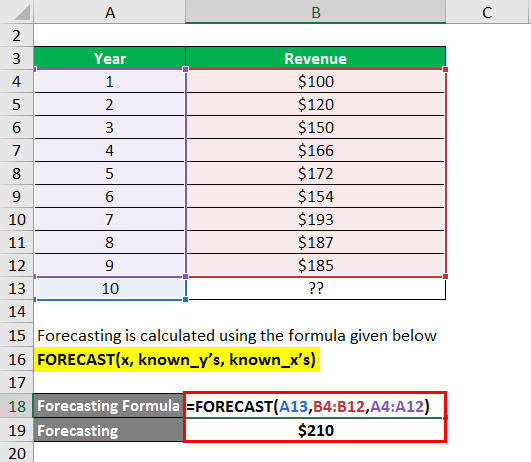
The Formula applied would be putting = sign in the cell by typing Forecast, a dropdown list would appear, and we will choose the last option stating the only Forecast. The formula or syntax would be (x, known_y’s, known_x’s). Here we will select the cell containing ten as x and the entire array of Revenue( From $100 – $185) as known_y’s. Similarly, we will select the array of Year ( from 1 – 9) and press Enter. In excel, to go to the next part of the formula, (,) is used. The result of $210 is displayed as the forecasted revenue for the 10th year.
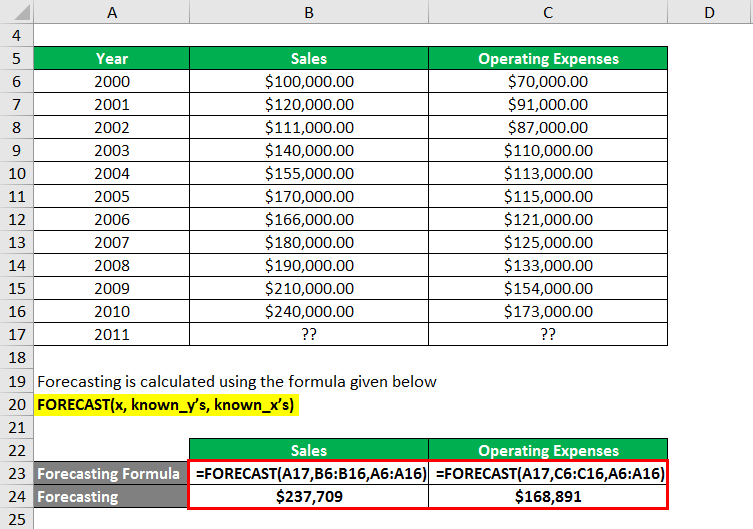
Forecasting Formula – Example #2
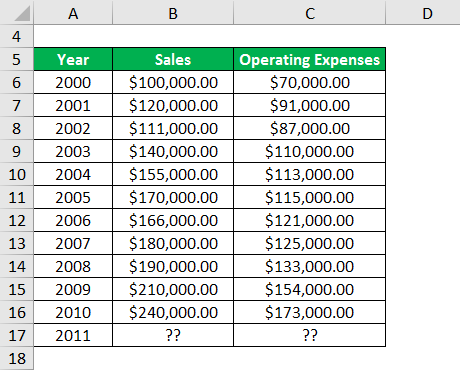
One of Japan’s companies is considering acquiring an American company based out of Birmingham, Alabama. Therefore, the data for the year 2011 is required for the company’s valuation. So, calculate the forecasted data of Sales and Operating Expenses for 2011 using the Forecasting formula in excel.
Solution:
We will follow the following steps to determine the forecasted result of Sales and Operating Expenses for 2011.
- First of all, we will check the completeness of the data. Then, in the given scenario, we have all the required inputs to apply the formula in its entirety.
- Next, we will use the ( = ) sign in the cell, denoting sales for the 2011 year, and choose Forecast from the dropdown list.
- After then, we will select the cell containing 2010 as x and the entire array of sales from ($1,00,000 – $2,40,000) as known_y’s and year ( 2000 – 2010 ) as known_x’s to calculate the forecasted figure. Finally, the result will be displayed in the requisite cell after hitting Enter.
- A similar process would be used for Expenses, but we will choose the array of Expenses in the same way we took for income in an erstwhile way.
Forecasting is calculated using the formula given below
FORECAST(x, known_y’s, known_x’s)
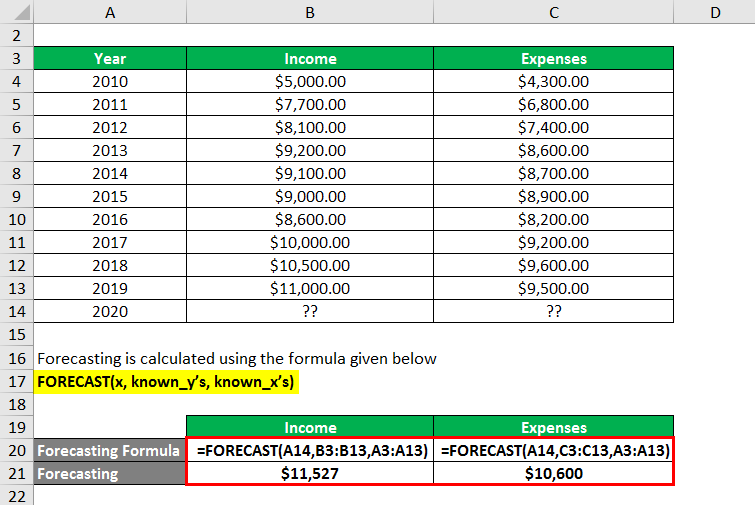
Forecasting Formula – Example #3
Similar to the previous example, Calculate the forecasted figure denoted by ( ??) for the year 2020 in the Income and Expenses column.
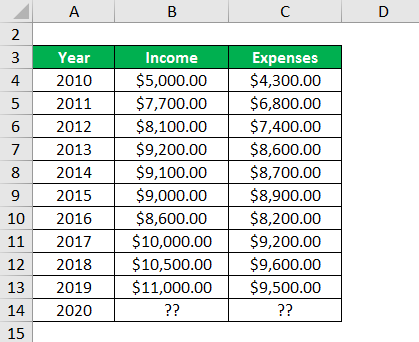
Solution:
We will follow the following steps to determine the forecasted result of Sales and Operating Expenses for 2011.
- First of all, we will check the completeness of the data. Then, in the given scenario, we have all the required inputs to apply the formula in its entirety.
- Next, we will use the ( = ) sign in the cell, denoting sales for the 2011 year, and choose Forecast from the dropdown list.
- After then, we will select the cell containing 2010 as x and the entire array of sales from ($1,00,000 – $2,40,000) as known_y’s and year ( 2000 – 2010 ) as known_x’s to calculate the forecasted figure. Finally, the result will be displayed in the requisite cell after hitting Enter.
- A similar process would be used for Expenses, but we will choose the array of Expenses in the same way we took for income in an erstwhile way.
Forecasting is calculated using the formula given below
FORECAST(x, known_y’s, known_x’s)
Explanation
The formula for Forecasting can be calculated by using the following steps:
If we need to calculate a predictive estimate of future numbers, we could use the Forecast function in the Microsoft Excel program.
Step 1: First of all, we require a complete data set where there are dependent and independent variables of which the forecast would be made.
Step 2: When we have the relevant data, locate the cell where the result would be displayed.
Step 3: Once the cell is identified, apply the Forecast Formula in excel to get the result or forecasted number.
Key Notes:
- The length of known_x’s and known_y’s should be the same. If that is not the same or one or more arrays are unfilled, we will get an error (#N/A! error).
- If the cell contained in the known_x’s array is zero, an error is known as #DIV/0! An error would be displayed.
- The error code, #VALUE! The error will be displayed if the forecasted value is other than numerical.
Relevance and Uses of Forecast Function
The Forecasting function helps calculate future or required data based on past numbers. The Forecast function is generally used in calculating predictions of multiple financial variables such as Sales, Profit, Expenses, Free Cashflows, etc. The results fetched help analysts to value the company, whether listed or not, and make an informed decision.
Recommended Articles
This is a guide to Forecasting Formula. Here we discuss how to calculate the Forecasting Formula along with practical examples. We also provide Forecasting, a downloadable excel template. You may also look at the following articles to learn more –
