Updated July 6, 2023
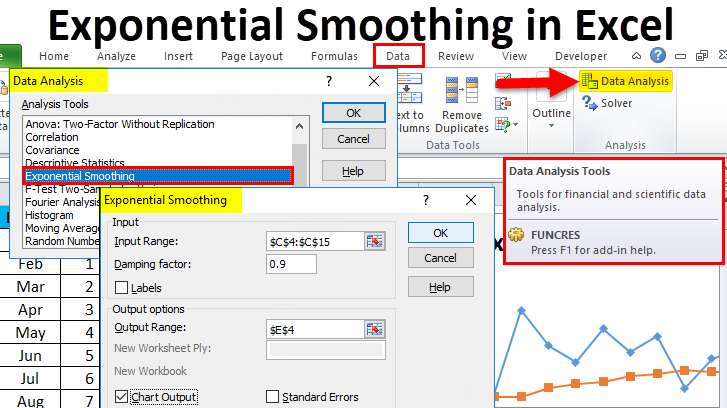
Table of Contents:
- What is Exponential Smoothing in Excel?
- How to Use Exponential Smoothing to Forecast in Excel?
- Example #1: Higher Weightage to Recently Forecasted Value
- Example #2: Higher Weightage to Historical Data
- Example #3: Equal Weightage to All Data
- Comparing Forecasted Values from all Examples
- How are Weights Distributed? (Back-End Process)
- Snapshot for Weightage Distribution
What is Exponential Smoothing in Excel?
Exponential smoothing is a popular in-built forecasting tool in Excel that uses past data to predict future values. For example, if you have annual sales data for five years (2017-2022), you can use exponential smoothing in Excel to predict value for the next year, i.e., 2023. Typically, exponential smoothing predicts what the next value will be by smoothing out any ups and downs in the data, like extreme highs or lows (peaks and valleys).
Businesses mostly use exponential smoothing in Excel to predict future expenses, budgets, inventory, sales, etc.
How to Use Exponential Smoothing to Forecast in Excel?
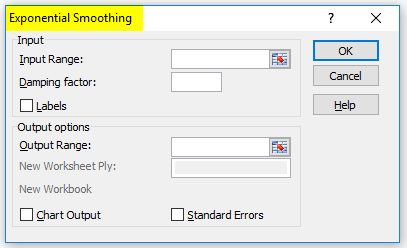
To do the exponential smoothing tool in Excel, you need to enter the following data in the exponential smoothing dialog box. Follow the below steps to use Excel Exponential Smoothing:
- Click the “Data Analysis” tool on the “Data” tab.
- Select the “Exponential Smoothing” option.
- Enter the “Input Range.” It is the range of data you want to forecast.
- Enter the “Damping factor.” You can calculate it using 1 – α.
- Enter the “Output Range”. It is the range where you want the output data.
- Tick the “Chart Output” checkbox to display a chart.
- Click “OK.”
Alpha Value (α): α is the smoothing constant, also known as the alpha value. The alpha value determines how much weight to give to the data points for the forecasting. It can be between 0 and 1, where a smaller alpha value gives more weight to recently forecasted data, and a larger value gives more weight to historical data.
Now, let us see examples of exponential smoothing forecasting using Excel.
Example #1: Higher Weightage to Recently Forecasted Value
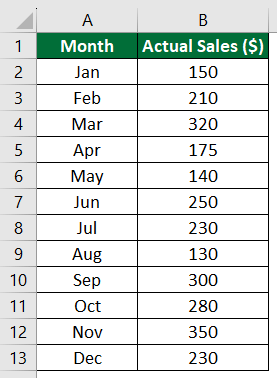
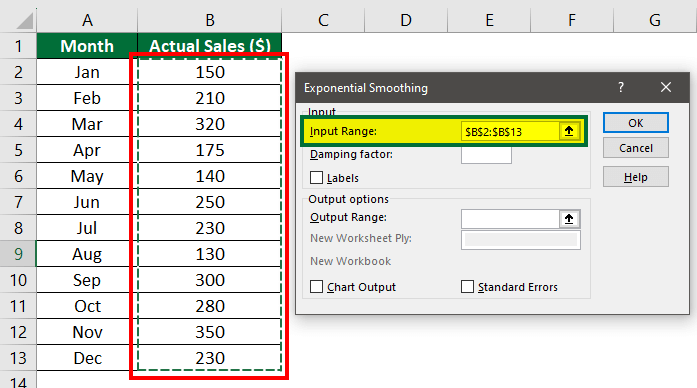
We have the sales data for each month of the current year for a company. Let’s see how to calculate next year’s sales (forecast sales) using the Excel exponential smoothing method. We will use alpha (α) as 0.2 to give higher weightage to the recently forecasted value and less weight to older or historical data.
Solution:
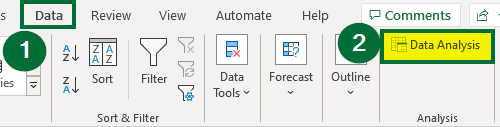
Step 1: Select the “Data Analysis” option from the “Data” tab.
A “Data Analysis” window will appear.
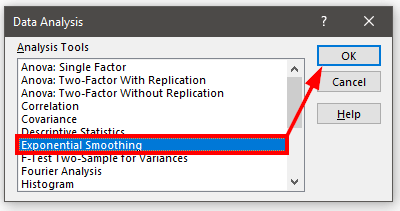
Step 2: Select “Exponential Smoothing” and click on the “OK” button, as shown below.
A dialog box of “Exponential Smoothing” will appear, as shown below.
Step 3: Select $B$2:$B$13 under “Input Range” to apply exponential smoothing in this range.
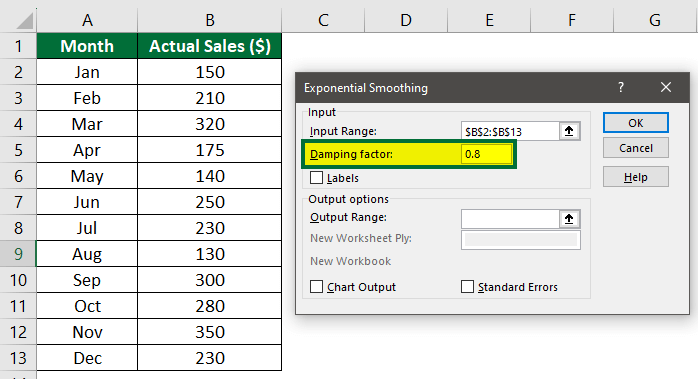
Step 4: Enter “0.8” in the “Damping factor”.
1- α = 1 – 0.2 = 0.8.
Step 5: Select “Cell C2” in the “Output Range” to display the forecasted values in that cell.
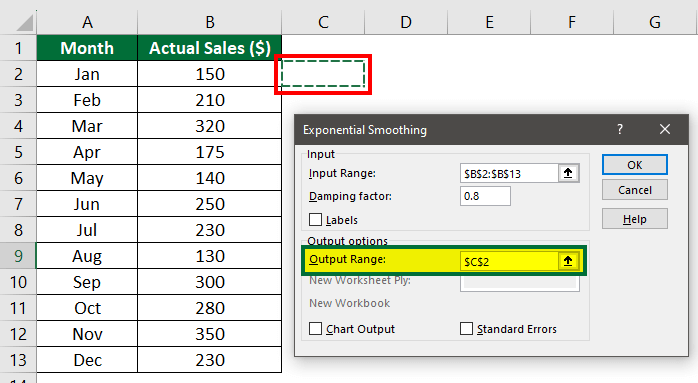
Step 6: Tick on the “Chart Output” box to display a chart with the actual and forecasted values, and then click “OK”.
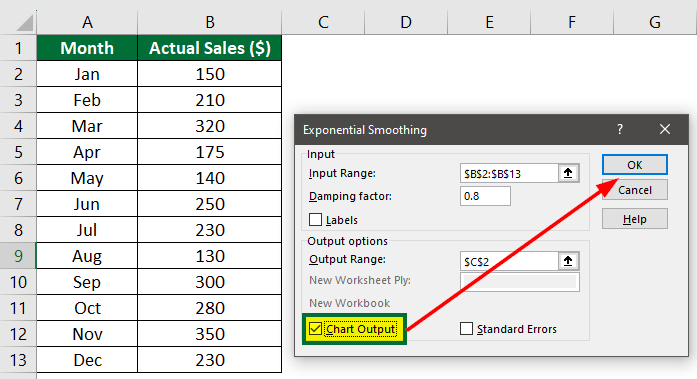
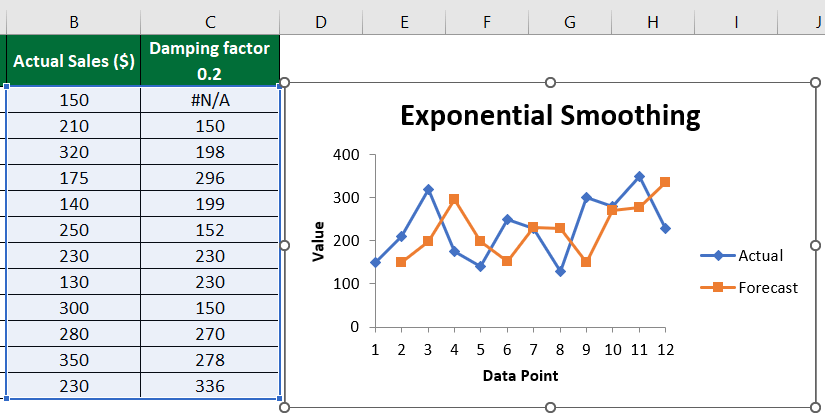
The forecasted values will appear in the specified output range, and an exponential smoothing chart will appear.
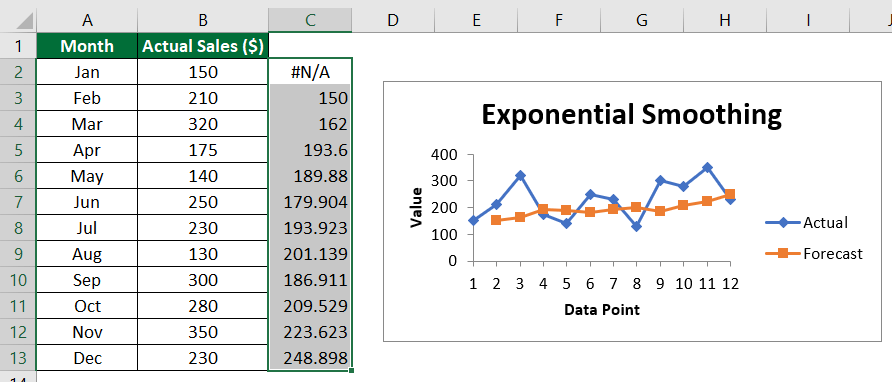
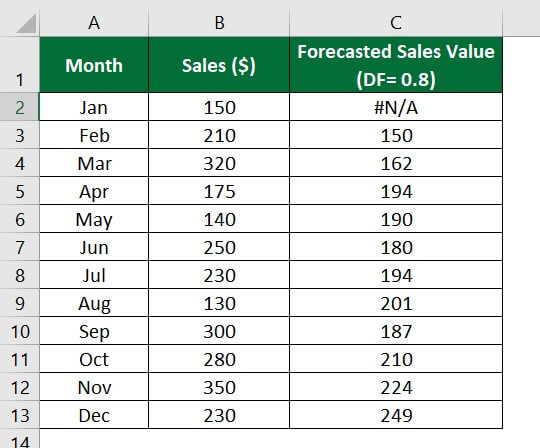
The forecast sales values are in decimal form. To round off these sales values, click on the “Decrease Decimal” option available in the “Number” group of the “Home” tab.
In the above graph:
- The forecasted values show an increasing trend.
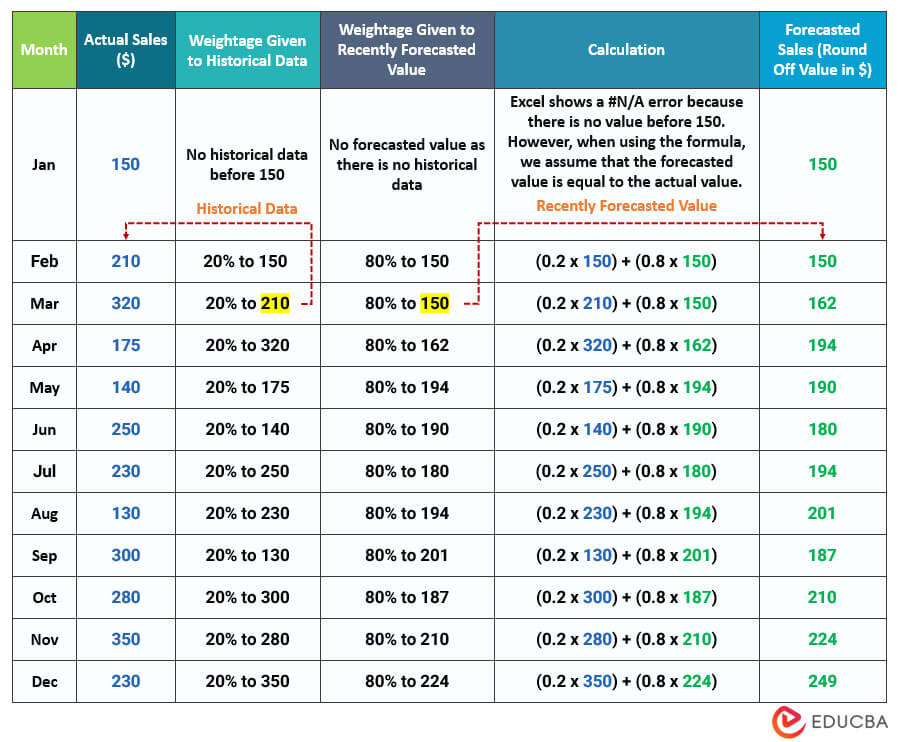
- The first forecasted or smoothed value, i.e., Cell C1, appears as “#N/A” as there is no previous data point. It means that there is no value before Cell B1 to calculate its forecast value.
- The second forecasted value, Cell C2, has the same value as the first value of the past/historical dataset, i.e., Cell B1.
- Here, the α value is small, and the damping factor is large so that the result will have a higher degree of smoothing. It means there are fewer peaks and valleys in the forecasted values, and the graph is smooth.
- Also, it gives more weight to recently forecasted value and less weight to older or historical data, i.e., data of column B. This results in a smoother forecast.
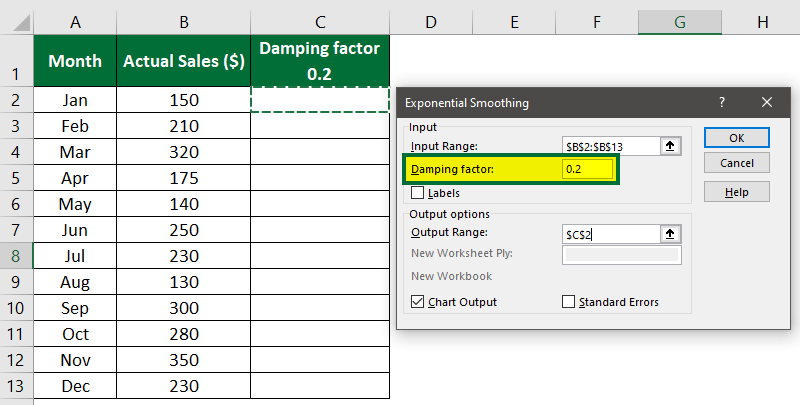
Example #2: Higher Weightage to Historical Data
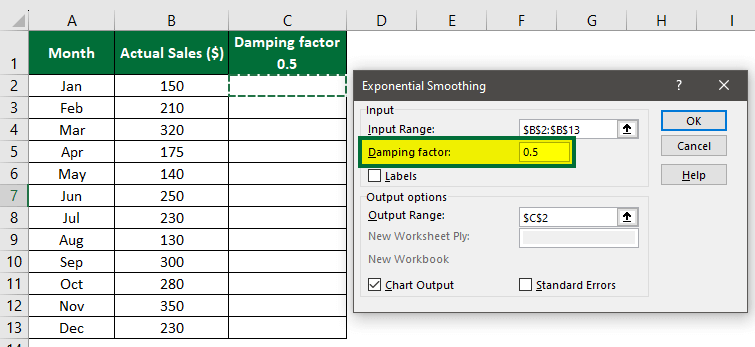
In this example, let us use the same data points as Example #1. Here, we will use the alpha value as 0.8 to give higher weightage to the historical data. Thus, the damping factor will be 0.2 (1 – 0.8).
Solution:
Follow the steps of the above example. But instead of 0.8, enter “0.2” in the “Damping factor” option.
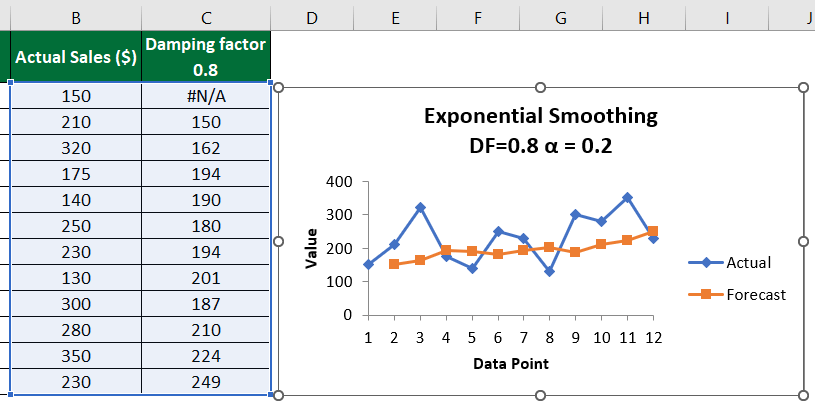
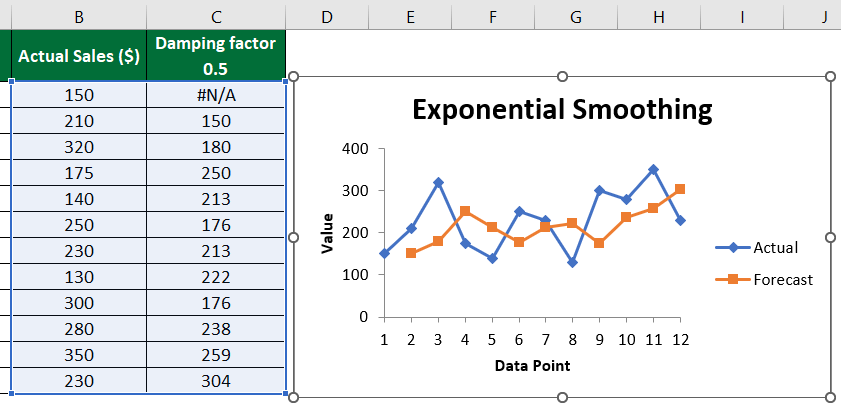
In the above graph:
- The first smoothed value in Cell C1 appears as “#N/A” as there is no value before Cell B1 to calculate its forecast value.
- Therefore, the second forecasted value in Cell C2 is the same as the first value of the previous data present in Cell B1.
- Here, the α value is more, and the damping factor is less, so the result will have a lower degree of smoothing. It means the forecasted values will have an irregular line pattern.
- It gives less weight to recently forecasted values and more weight to historical data. Hence the smoothed value will be closer to the actual data points.
Example #3: Equal Weightage to all Data
Let’s consider the alpha in exponential smoothing as 0.5 so the damping factor will become 0.5.
Solution:
Follow the steps from “Example #1,” but enter “0.5” in the “Damping factor.”
In the above graph:
- When we take the alpha value as 0.5, the exponential smoothing gives equal weightage, meaning it gives 50% weightage to recently forecasted and historical data.
- We can use alpha as 0.5 when the data has both short-term fluctuations and long-term trends.
- Around half of the predicted values are closer to the actual values, while the other half differ more from the actual values.
Comparing Forecasted Values from all Examples
Let’s create a line graph to understand the patterns of forecasted or smoothed values for these three conditions: α = 0.2, α = 0.8, and α = 0.5.
Follow the below steps:
Step 1: Combine all the results in one table, as shown below.
Step 2:
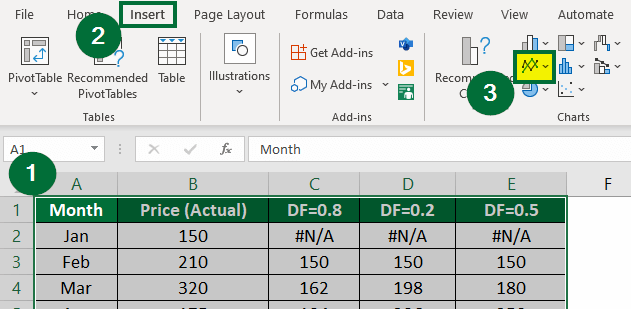
- Select the data.
- Go to the “Insert”
- Click on the “Line” chart, as shown below.
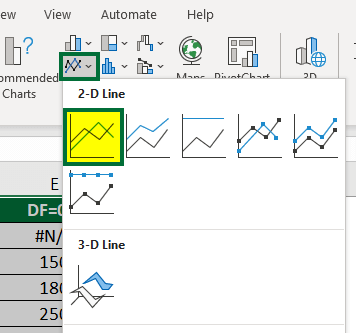
Step 3: Under the Line chart, you can select any format. Here we have chosen the below line chart format.
The chart will look like this:
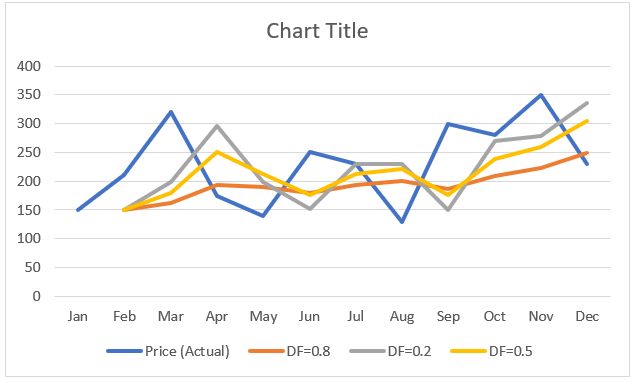
We have modified the above graph by changing the style format, line color, and chart title, as shown below.
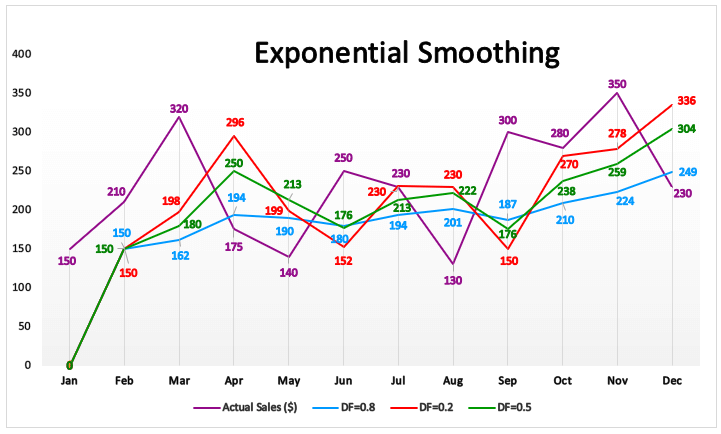
As you can see in the above graph, there is a difference in the sales values of each month in the current and forecasted year. The difference is due to different alpha values or damping factors.
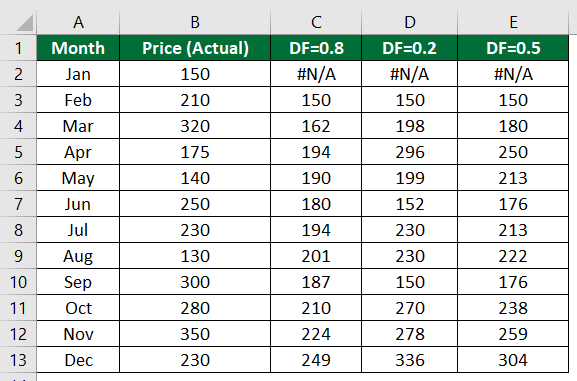
The table below shows this difference for the month of December when the actual sales were $230.
| When α is: | DF is: | Actual Sales in December ($): | Forecasted Sales in December ($): |
| 0.2 | 0.8 | 230 | 249 |
| 0.8 | 0.2 | 230 | 336 |
| 0.5 | 0.5 | 230 | 304 |
How are Weights Distributed? (Back-End Process)
The examples show how quickly exponential smoothing in Excel forecasts the results.
For example, when α = 0.2 (DF=0.8), exponential smoothing gives us the following forecasted sales values:
How did Excel calculate these forecasted values so easily?
Let us understand the logic behind this calculation.
To calculate the current forecasted value, Excel simply assigns weightage to the historical value and recently calculated forecasted value using the following formula:
The image below explains how Excel applies this formula to each value in the back end.
Snapshot for Weightage Distribution
Here is a simple snapshot for remembering how exponential smoothing assigns weights to data.
| Conditions | Weightage to Recently Forecasted Data | Weightage to Historical Data |
| Smaller alpha value (α close to 0) OR Larger damping factor |
More weight | Less weight |
| Larger alpha value (α close to1) Or Smaller damping factor |
Less weight | More weight |
Frequently Asked Questions (FAQs)
Q1. What type of forecasting is exponential smoothing?
Answer: Exponential smoothing is a time series forecasting method in Excel. Excel has three types of exponential smoothing: Simple, Double, and Triple Exponential Smoothing.
- Simple or single exponential smoothing is useful for univariate data with no trend and needs only one parameter, like alpha (α).
- Double exponential smoothing is useful for data with trend indicators and needs two parameters like alpha (α) and beta (b)
- Triple exponential smoothing is useful for data with more trends and seasonal variations and needs three parameters, alpha (α) and beta (b), and gamma (g).
Q2. Which Excel tool performs exponential smoothing forecasts?
Answer: Excel Data Analysis tool performs exponential smoothing forecasts. The Data Analysis tool is present in the Analysis-ToolPak from the Excel Add-in.
Q3. What are the limitations of exponential smoothing?
Answer: Excel exponential smoothing neglects the ups and downs pattern associated with random variation. It doesn’t give accurate results when cyclical or seasonal variations are present in the data.
Recommended Articles
This article is a step-by-step guide on how to use Exponential Smoothing in Excel using different alpha values, along with a downloadable template. You may also look at the below article for your reference:
