Updated March 24, 2023

What is Exploratory Data Analysis?
Exploratory Data Analysis is a basic data analysis technique that is acronymic as EDA in the analytics industry. EDA is associated with several concepts and best practices that are applied at the initial phase of the analytics project. EDA is associated with graphical visualization techniques to identify data patterns and comparative data analysis. EDA is a preferred technique for feature engineering and feature selection processes for data science projects. Some of the widely used EDA techniques are univariate analysis, bivariate analysis, multivariate analysis, bar chart, box plot, pie carat, line graph, frequency table, histogram, and scatter plots. EDA is very useful for the data preparation phase for which will complement the machine learning models.
How Exploratory Data Analysis is Performed?
Let us see how the exploratory data analysis is performed:
1. Univariate Analysis
‘Uni’ means ‘One.’ As the name suggests, univariate analysis is the data analysis where only a single variable is involved. The variable can be either a ‘Categorical’ variable or ‘Numerical’ variable. Let us discuss the most commonly used graphical methods used for exploratory data analysis of univariate analysis.
2. Frequency Table and Count Plot
Frequency tables or count plots are used to identify the frequency or how many times a value occurs. For example, we are tossing an unbiased coin 5 times (H, T, H, H, T). The frequency or count of the head here is 3. Let us see how the count plot looks from a movie review data set. Count plot is also referred to as a bar plot because of the rectangular bars. We generate bar plot in python using the Seaborn library.
Count plot of Movie Review Dataset
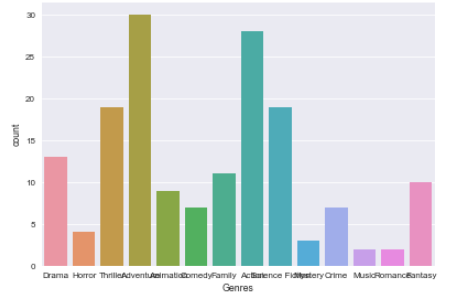
Source Link: https://stackoverflow.com/questions/48043365/how-to-improve-this-seaborn-countplot
3. Histograms
Histograms are the smoothen version of Kernel density estimation. Histograms help us to get knowledge about the underlying distribution of the data. For example, a normal (bell-shaped curve) distribution’s preprocessing methodologies will be significantly different from other skewed distributions like the Pareto distribution. Let’s see how the distribution of flight arrival displays in the form of a histogram.
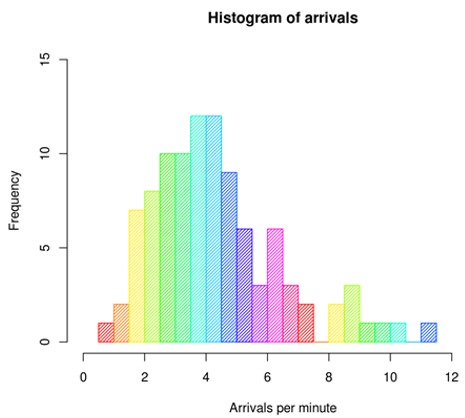
Source: Wikipedia
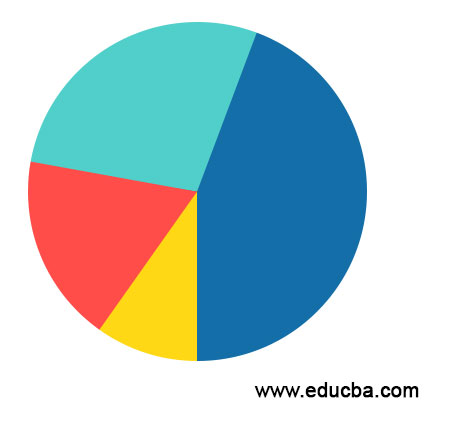
4. Pie Chart
A pie chart is a circle which is divided into parts based on the relative count or frequency of a sample or population. Suppose we want to compare the relative performance or sales or multiple products, a pie chart is a useful graphical way to visualize it.
5. Box Plot with Whisker and Violin Plot
Box plot with whisker is used to graphically display the 25-50-75 percentile values of the variable. Box plot gives us a clear picture of where 50%, 25%, or 95% of the values lie in our data. Violin plot is the enhanced plot of boxplot which includes some more information (distribution of the variable) of the variable. Let us show how the boxplot and violin plot looks.
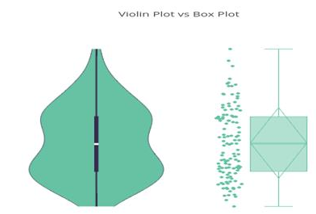
Source: Wikipedia
6. Multivariate Analysis
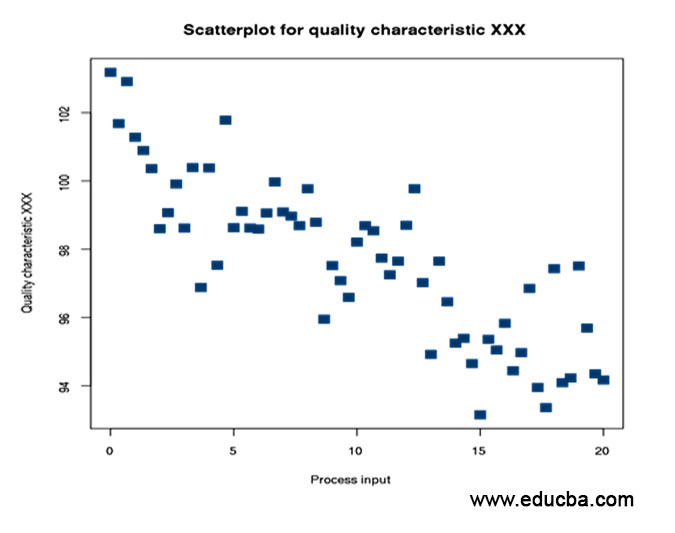
Multivariate analysis is the methodology of comparative analysis between multiple variables. If we compare the two variables it is called bi-variate analysis. Scatter plots, contour plots, multivariate probability density plots are the most commonly used graphical methods to analyze multi-dimensional data. Let us show how a scatter plot looks like.
Advantages and Disadvantages of Exploratory Data Analysis
Below are given the advantages and disadvantages of Exploratory Data Analysis:
Advantages of EDA
- It gives us valuable insights into the data.
- It helps us with feature selection (i.e using PCA)
- Visualization is an effective way of detecting outliers.
Disadvantages of EDA
- If not perform properly EDA can misguide a problem.
- EDA does not effective when we deal with high-dimensional data.
Applications of Exploratory Data Analysis
Let’s analyze the applications of Exploratory Data Analysis with a use case of univariate analysis where we will seek the measurement of the central tendency of the data:
- Measurement of central tendency gives us an overview of the univariate variable. Central tendency is the measurement of Mean, Median, and Mode. Mean is the simple average where the median is the 50% percentile and Mode is the most frequently occurring value. Suppose we want the get the knowledge about the salary of a data scientist. Also, suppose we have carefully collected data of the data scientist with similar expertise and experience range.
- Now if we want to get the average it is simply the total salary of all the data scientists of the sample divided by the number of data scientists in the sample or population. But if you think carefully the average salary is not a proper term because in the presence of some extreme values the result will be skewed. Suppose for maximum cases the salary is between 8-10 LPA and for one or two cases it is 32 LPA. Now adding all these the average will be skewed. Median is more suitable for such situations, it is more robust to outliers.
Conclusion
In this article, we have discussed the various methodologies involved in exploratory data analysis, the applications, advantages, and disadvantages it. We also walked through the sample codes to generate the plots in python using seaborn and Matplotlib libraries. EDA is the art part of data science literature which helps to get valuable insights and visualize the data.
Recommended Articles
This is a guide to Exploratory Data Analysis. Here we discuss the Introduction to EDA, how Exploratory Data Analysis is Performed? along with applications of EDA and the advantages and disadvantages. You can also go through our other suggested articles –

