Updated June 12, 2023
Difference Between Excel vs Tableau
Excel is a spreadsheet application used for calculations, statistical operations, and data analyses. Many of the data analysts’ handy tools are Excel. Microsoft distributes it. Tableau is a business intelligence tool for Querying and reporting and online analytical processing and analytics. The data analysts use a visualization tool to get insights into the data from the business perspective and report.
Head-to-Head Comparison Between Excel vs Tableau (Infographics)
Below are the top 10 comparisons Between Excel vs Tableau: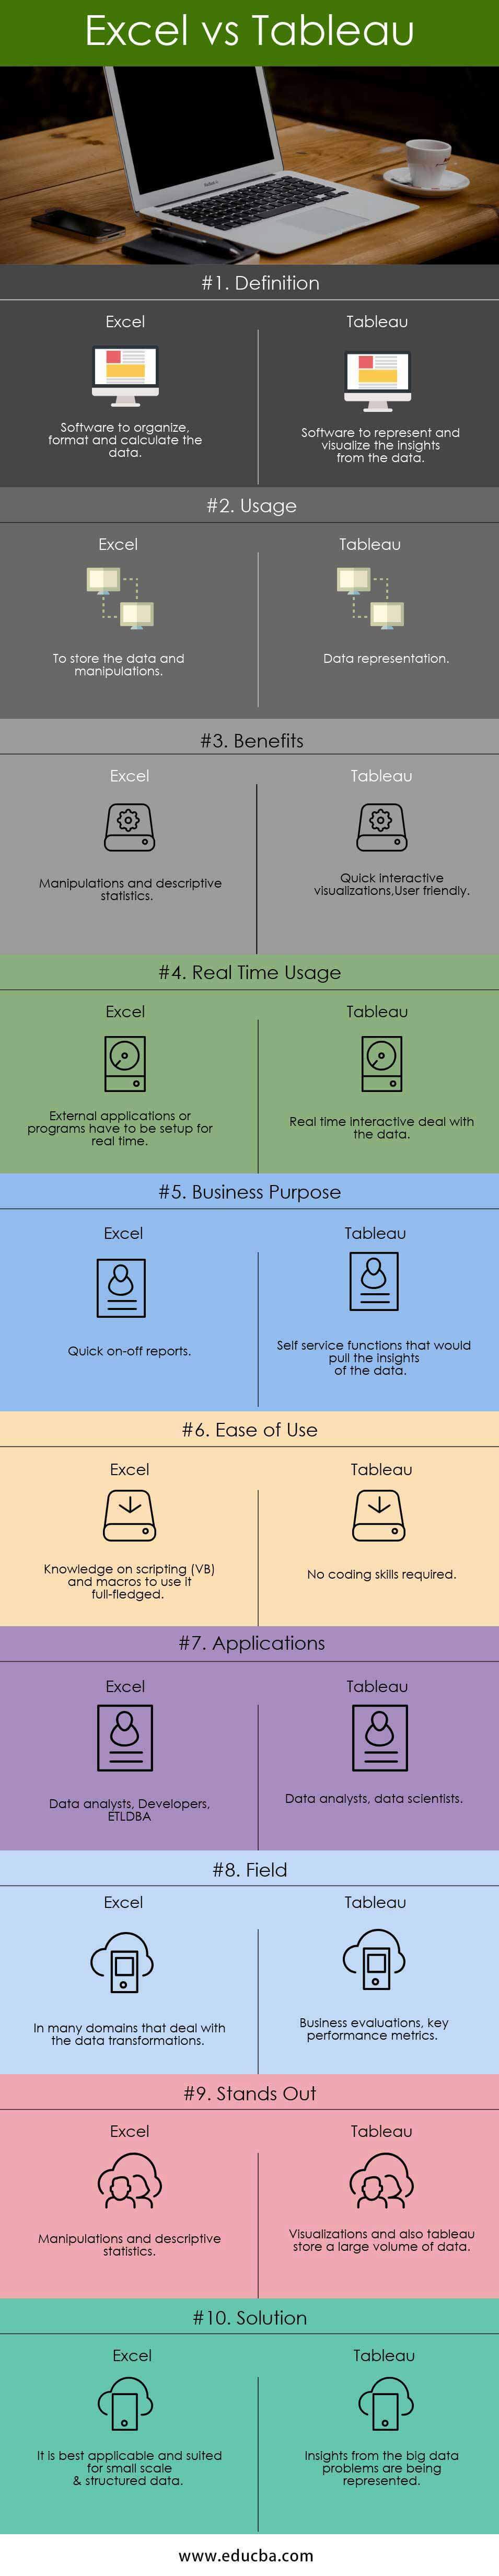
Key Differences Between Excel vs Tableau
Below are the lists of points that describe the key Differences Between Excel vs Tableau:
- Excel is spreadsheet software that deals with data transformations like calculations and manipulations using formulas. It goes with first data formatting and then representations. Tableau is one of the rich visualization tools in the market widely used for analytics.
- In this modern age, organizations prefer some enriching visualization tools to view the insights from the data that impact the business. Although Excel has some essential features, people consider it a structured traditional tool, and Tableau, founded in 2003, is a more modern and advanced data visualization tool than Excel.
- Excel also needs some vb(Visual Basic) scripting knowledge to use its functionalities and components fully. Tableau is very user-friendly, and it’s very easy to design a dashboard. Drag and drop is the key feature where the users find it easy to use this tool.
- Excel can connect to different external sources using plugins. Tableau has many references to join, and also it has the capability of a cloud. Also, there are some system requirements to access or develop using Excel. Tableau is much better at connecting live to external sources regarding speed and access.
- Tableau came into the market as a buzz because of organizations’ big data problems. Excel has been a limited resource when it comes to data. Excel also has limited rows and columns during usage.
- For any on-off reports, excel is a straightforward tool to use compared to Tableau, as the latter needs setup and configurations for any server deployments. For any short-term and minimal data for a business case, excel is a wise choice.
- In terms of the applications and the usage, it all depends on the business need. Tableau is the top choice for big data problems currently, and performing analytics on it to get insights even from the outliers. Whereas any descriptive analysis and mathematical transformations from the data and static reports, excel is the first choice.
- Tableau has multiple versions of desktop, prep, server, and cloud-based. Organizations choose the Excel version based on their needs and security considerations since Excel is a Microsoft-licensed software with office tools.
- Excel stores data points in cells and presents data in a tabular format, where each cell contains a value or information that can be accessed and represented. Then, graphs or charts are used to highlight the insights.
- Tableau primarily formats the data in a pictorial representation. It depicts the data’s trends and density through charts and graphs. It typically connects to any third-party tools to pull the data and visualize it. User access is very friendly and has drag & drop features which make the data analysts feasible to showcase their insights.
- Excel is used in various fields and also in many sectors. It is not limited to specific areas or data-related sectors. Even basic calculations and manipulations are used. The usage ranges from basic accounting to complex macros where VB(Visual Basic) scripts are to be developed.
- Tableau is explicitly used to visualize the data being pulled from external sources or data being used on the spot. Data analysts are the primary resources that use Tableau for many cases. It does not require any complex scripting. Ease access and user-friendly.
- Excel is a static tool where you load the data first and then do the representation. To plug in data from external sources using plugins, one must have advanced knowledge of Excel’s features and functions to implement the functionalities.
Excel vs Tableau Comparison Table
Below is the Comparison table between Excel vs Tableau:
|
Basis For Comparison |
Excel | Tableau |
| Definition | Software to organize, format, and calculate the data. | Software to represent and visualize the insights from the data. |
| Usage | To store the data and manipulations. | Data representation. |
| Benefits | Manipulations and descriptive statistics. | Quick interactive visualizations, User-friendly. |
| Real-Time Usage | External applications or programs have to be set up for real-time. | Real-time interactive deal with the data |
| Business purpose | Quick on-off reports. | Self-service functions that would pull the insights of the data. |
| Ease of use | Knowledge of scripting (VB) and macros to use it full-fledged. | You don’t need any coding skills. |
| Applications | Data analysts, Developers, ETL, DBA. | Data analysts, data scientists. |
| Field | In many domains that deal with data transformations. | Business evaluations, key performance metrics. |
| Stands out | Manipulations and descriptive statistics. | Visualizations and also tableau store a large volume of data. |
| Solution | It is best applicable and suited for small-scale & structured data. | Insights from the big data problems are being represented. |
Conclusion
In this modern age of technology, some say Excel and Tableau are mostly the same in terms of need and usage. But it is not. Both Excel and Tableau can perform the same functionalities. But how well enhancements can be taken forward, and the choice between Excel and Tableau comes. Any developer or researcher would prefer Excel over Tableau, as it has been for years and years. People hesitate to move forward with new tools and applications. Tableau has gained popularity due to its business intelligence capabilities and ability to build dashboards.
As big data problems arise more and more in this age, companies will bring different visualization tools to the market. An industry cannot stick to one particular tool for any data analytics. It’s a switch between both Excel and Tableau. There might be cases where Excel and Tableau come into the picture that convinces an end product. Excel has powerful capabilities, and Tableau is getting more mature because of many big data use cases.
Recommended Articles
This has been a guide to Excel vs Tableau. Here we have discussed Excel vs Tableau head-to-head comparison, key differences, infographics, and comparison table. You may also look at the following articles to learn more –
