EDUCBA

EDUCBA

MENUMENU
  • Free Tutorials
  • Certification Courses
  • 120+ Courses All in One Bundle
  • Login

Excel Standard Deviation Formula

By Pradeep SPradeep S

Home » Excel » Blog » Statistical Functions in Excel » Excel Standard Deviation Formula

Standard Deviation in Excel

Excel Standard Deviation Formula (Table of Contents)

  • Standard Deviation Formula in Excel
  • How to Use Standard Deviation Formula in Excel?

Standard Deviation Formula in Excel

Standard Deviation is widely used in statistical calculation. Standard Deviation is the deviation of the range about the mean value. Or if we say in simple words, it shows how much the number of values differs from the mean value of the selected range.

Start Your Free Excel Course

Excel functions, formula, charts, formatting creating excel dashboard & others

There are two types of Standard Deviations;

  1. Low Standard Deviation
  2. High Standard Deviation

Low Standard Deviation has a value of standard deviation close to mean value; thus, the curve becomes stiffer at the top and small towards the bottom. Whereas in High Standard Deviation, the standard deviation has value away from the mean value with this curve becomes smooth at the top and wider towards the bottom.

How to Use Standard Deviation Formula in Excel?

Let’s understand how to calculate Standard Deviation in Excel using formula using some examples and how to plot a graph of Standard Deviation in Excel.

You can download this Standard Deviation Formula Excel Template here – Standard Deviation Formula Excel Template

The syntax for Standard Deviation Formula in Excel –

Standard Deviation formula can be used from Insert Function, which is situated beside the formula bar by clicking on the fx icon.

Standard Deviation Formula Syntax

Standard Deviation Formula in Excel – Example #1

We have sample sales data of a product, where we observed a huge deviation in the sale for 10 days. Now let’s see and calculate how much deviation we are getting for the selected data set.

Standard Deviation Formula example 1-1

For calculating standard deviation, first, go to the cell where we need the output. Then go to the insert function option located beside the formula bar, as shown below.

Popular Course in this category
Sale
Excel Advanced Training (16 Courses, 23+ Projects)16 Online Courses | 23 Hands-on Projects | 140+ Hours | Verifiable Certificate of Completion | Lifetime Access
4.8 (11,383 ratings)
Course Price

View Course

Related Courses
Excel for Marketing Training (8 Courses, 13+ Projects)

Standard Deviation Formula example 1-2

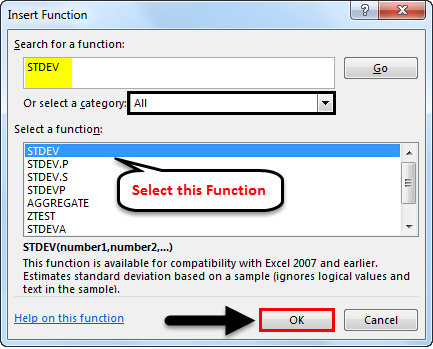
Once we do that, we will get the Insert Function box. From here, select Standard Deviation function, which is available as STDEV from Statistical category from the Or select a category or from there select ALL category to look for required function as shown below. Once we are done with selecting the function, click on OK.
Standard Deviation Formula example 1-3

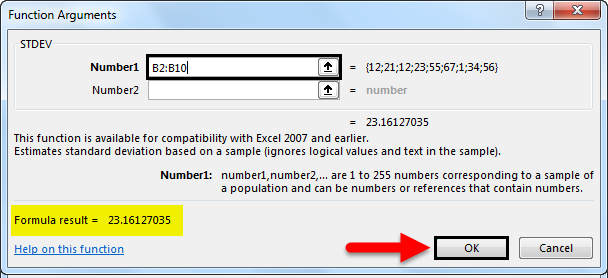
Once we click on OK, it will take us to Function Argument of Standard Deviation. Now we will see two number ranges, Number1 and Number2. Go to Number1 and select the complete range. Here we have selected a range from cell B2 to B10.

Note – Any number range can accommodate only 255 cell count. If it exceeds, we can use Number2, Number3… as so on.

Standard Deviation Formula example 1-4

As we can see in the above screenshot, we already have a formula result at the bottom left of the box for the selected range. If the selected range is incorrect, then there will not be any value shown.

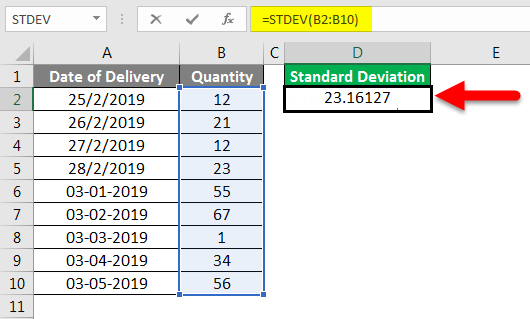
After clicking on OK, we can see the selected range’s standard deviation in the selected cell.

Standard Deviation Formula example 1-5

Now let’s understand what it means. As we can see, our standard deviation value is showing as 23.16127, which means for the selected range, if our mean comes as 31.22, then the selected range can deviate 23.16127 about the mean value.

Standard Deviation Formula in Excel – Example #2

There is another way to calculate the Standard Deviation formula in Excel. For that, let’s consider the same data which we have seen in the above example.

Standard Deviation Formula example 2-1

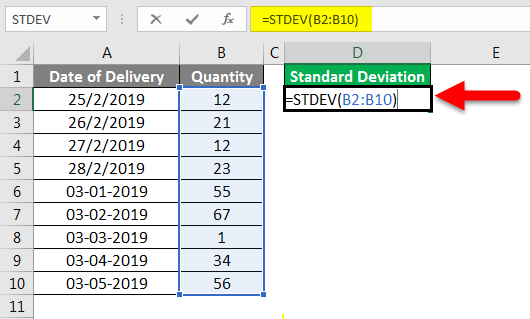
For calculating the standard deviation formula in excel, go to the cell where we want to see the result and type the ‘=’ (Equal) sign. This will enable all the inbuilt functions in excel. Now, search for Standard Deviation by typing STDEV, which is the key word to find and select it as shown below.

Standard Deviation Formula example 2-2

Now select the complete range. Here we have selected the range from cell B2 to B10.
Standard Deviation Formula example 2-3

Press Enter to come out of the edit mode, and we will see the calculated value of standard deviation, as shown below.

Standard Deviation Formula example 2-4

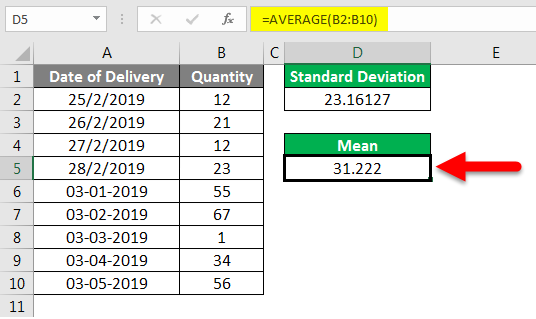
As we can see, the standard deviation value is coming as 23.16127. We can also calculate the mean value of the same data to compare how much deviation of data we are getting about the mean value with the AVERAGE formula’s help.
Standard Deviation Formula example 2-5

For the demonstration, we have shown how standard deviation and mean are connected with each other. The mean value 31.222 is at the centerline of the whole range, and the Standard Deviation is a little far away from the mean value. It can be towards both sides of the mean.

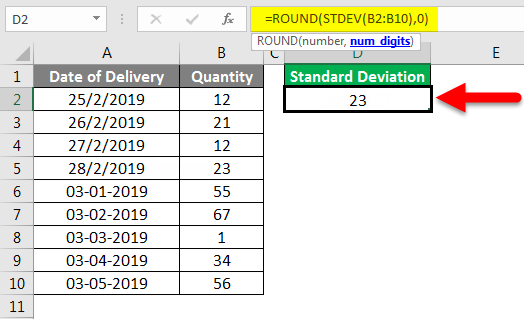
Also, for the value with decimal digits up to 4 and 5, we can make it in the round figure using the ROUND function before the standard deviation. For the type ROUND before STDEV and select the num_digit as 0 as shown below. Once we press Enter, we will get the round figure value of standard deviation as shown below. This will give us the perfect rounded value, which we can use further for other analysis.

Standard Deviation Formula example 2-6

Standard Deviation Formula in Excel – Example #3

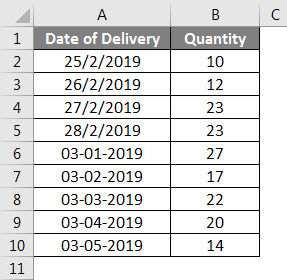
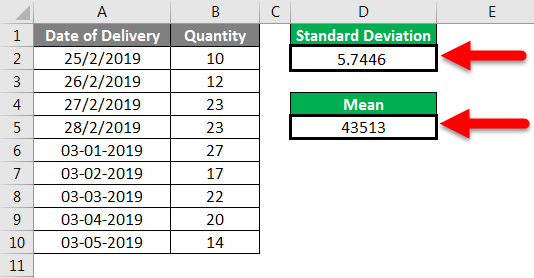
Let’s see another set of data for Standard Deviation calculation in Excel, as shown below.

Standard Deviation Formula example 3-1

Now, as shown in the above example 1 and 2, calculate the Standard Deviation and Mean.
Standard Deviation Formula example 3-2

Now for plotting it on a graph, select the complete data and go to Insert Menu; under Charts, select Scatter chart with Smooth Lines and Markers, which is best suited for plotting Standard Deviation as shown below.
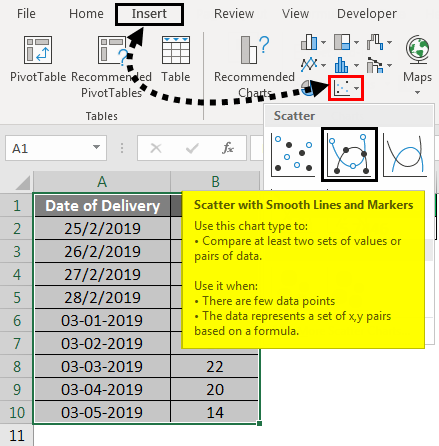
Standard Deviation Formula example 3-4

Once we click on it, we will get the points plotted on the Standard Deviation graph, as shown below.
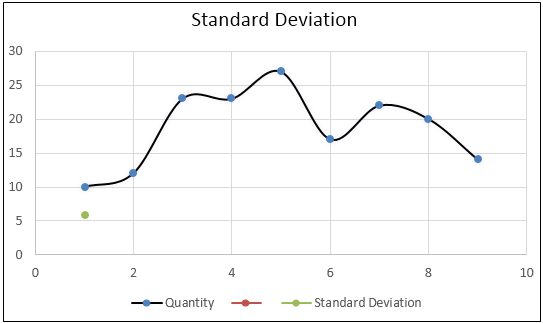
Standard Deviation Formula example 3-3

As we can see above, we got a curve, and all the points are in their range.

Things to Remember About Standard Deviation Formula in Excel

  • Select the complete range. If there is any cell break, consider the cell break and include that into range.
  • Always consider the reference of Mean value so that calculated standard deviation can be measured about.
  • The standard deviation formula in excel always deviates from both sides of the mean value, but it can be skewed towards any of the axis in some cases.

Recommended Articles

This has been a guide to the Standard Deviation Formula in Excel. Here we discussed How to Calculate Standard Deviation using Formula in Excel along with practical examples and a downloadable excel template. You can also go through our other suggested articles –

  1. Excel Square Root Function
  2. Excel MAX IF Function
  3. Excel Grade Formula
  4. Excel AVERAGE Function

All in One Excel VBA Bundle (120+ Courses, 30+ Projects)

120+ Online Courses

30+ Projects

500+ Hours

Verifiable Certificates

Lifetime Access

Learn More

0 Shares
Share
Tweet
Share
Primary Sidebar
Excel Functions
  • Statistical Functions in Excel
    • COUNTIF Formula in Excel
    • COUNTIF Multiple Conditions
    • COUNTIFS with Multiple Criteria
    • Statistics in Excel
    • Confidence Interval in Excel
    • Interpolate in Excel
    • Linear Programming in Excel
    • COUNTIFS in Excel
    • Excel Variance
    • Normal Distribution Formula in Excel
    • Count Cells with Text in Excel
    • Excel Formula For Rank
    • Linear Regression in Excel
    • COUNTA Function in Excel
    • MAX Formula in Excel
    • Excel NORMSINV
    • Count Names in Excel
    • FORECAST Formula in Excel
    • NPER in Excel
    • Excel Median Formula
    • Lognormal Distribution in Excel
    • Excel Chi Square Test
    • Count Formula in Excel
    • COUNTIF Examples in Excel
    • Excel P-Value
    • COUNTIF Not Blank in Excel
    • Excel Standard Deviation Formula
    • Excel GROWTH Formula
    • Excel Percentile Formula
    • Excel Frequency Formula
    • Excel Average Formula
    • Excel Correlation Matrix
    • Excel Z Score
    • Excel MAX IF Function
    • Z TEST in Excel
    • Excel Trendline
    • Excel F-Test
    • Excel STDEV Function
    • Excel Frequency Distribution
    • DCOUNT Function in Excel
    • Excel MIN Function
    • Excel Forecast Function
    • FREQUENCY Excel Function
    • COUNTIF with Multiple Criteria
    • Standard Deviation in Excel
    • MAX Excel Function
    • Excel QUARTILE Function
    • Excel T.Test Function
    • Excel PERCENTILE Function
    • MODE Excel Function
    • SLOPE Excel Function
    • Excel Median Function
    • Excel TREND Function
    • Excel Count Function
    • Excel LARGE Function
    • SMALL Excel Function
    • COUNTIF Excel Function
    • Excel AVERAGE Function
    • Excel CORREL Function
  • Excel Functions (12+)
  • Excel Tools (114+)
  • Financial Functions in Excel (17+)
  • Logical Functions in Excel (14+)
  • Lookup Reference Functions in Excel (34+)
  • Maths Function in Excel (47+)
  • TEXT and String Functions in Excel (26+)
  • Date and Time Function in Excel (23+)
  • Information Functions in Excel (4+)
  • Excel Charts (56+)
  • Excel Tips (222+)
  • Workplace Productivity (4+)
  • Microsoft Office Tools (15+)
  • Excel Formula and Functions (21+)
  • MS Excel Shortcuts (4+)
Excel Functions Courses
  • EXCEL ADVANCED Training Certification
  • Online Excel for Marketing Course
Footer
About Us
  • Blog
  • Who is EDUCBA?
  • Sign Up
  • Live Classes
  • Corporate Training
  • Certificate from Top Institutions
  • Contact Us
  • Verifiable Certificate
  • Reviews
  • Terms and Conditions
  • Privacy Policy
  •  
Apps
  • iPhone & iPad
  • Android
Resources
  • Free Courses
  • Excel Charts
  • Excel Tips
  • All Tutorials
Certification Courses
  • All Courses
  • Excel VBA Course - All in One Bundle
  • VBA Course
  • Excel Data Analysis Course
  • Excel for Marketing Course
  • Excel for Finance Course
  • Excel for HR Training

© 2022 - EDUCBA. ALL RIGHTS RESERVED. THE CERTIFICATION NAMES ARE THE TRADEMARKS OF THEIR RESPECTIVE OWNERS.

EDUCBA
Free Excel Course

Excel functions, formula, charts, formatting creating excel dashboard & others

*Please provide your correct email id. Login details for this Free course will be emailed to you

By signing up, you agree to our Terms of Use and Privacy Policy.

EDUCBA
Free Excel Course

Excel functions, formula, charts, formatting creating excel dashboard & others

*Please provide your correct email id. Login details for this Free course will be emailed to you

By signing up, you agree to our Terms of Use and Privacy Policy.

EDUCBA Login

Forgot Password?

By signing up, you agree to our Terms of Use and Privacy Policy.

Let’s Get Started

By signing up, you agree to our Terms of Use and Privacy Policy.

EDUCBA

*Please provide your correct email id. Login details for this Free course will be emailed to you

By signing up, you agree to our Terms of Use and Privacy Policy.

EDUCBA

Download Standard Deviation Formula Excel Template

EDUCBA

डाउनलोड Standard Deviation Formula Excel Template

This website or its third-party tools use cookies, which are necessary to its functioning and required to achieve the purposes illustrated in the cookie policy. By closing this banner, scrolling this page, clicking a link or continuing to browse otherwise, you agree to our Privacy Policy

Loading . . .
Quiz
Question:

Answer:

Quiz Result
Total QuestionsCorrect AnswersWrong AnswersPercentage

Explore 1000+ varieties of Mock tests View more

Special Offer - EXCEL ADVANCED Training Certification Learn More