Updated August 23, 2023

Standard Deviation Formula in Excel
In this article, we will learn about Standard Deviation Formula in Excel. It is widely used in statistical calculation. Standard Deviation is the deviation of the range about the mean value. Or, if we say it simply, it shows how much the number of values differs from the mean value of the selected range.
There are two types of Standard Deviations;
- Low Standard Deviation
- High Standard Deviation
A low Standard Deviation has a value standard deviation close to the mean value; thus, the curve becomes stiffer at the top and small towards the bottom. Whereas in High Standard Deviation, the standard deviation has value away from the mean value, with this curve becoming smooth at the top and wider towards the bottom.
How to Use Standard Deviation Formula in Excel?
Let’s understand how to calculate Standard Deviation in Excel using a formula using some examples and how to plot a graph of Standard Deviation in Excel.
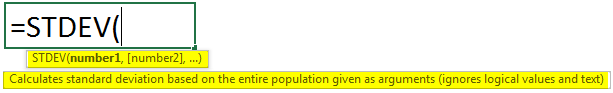
The syntax for Standard Deviation Formula in Excel –
The standard deviation formula can be used from Insert Function, beside the formula bar, by clicking the fx icon.
Standard Deviation Formula in Excel – Example #1
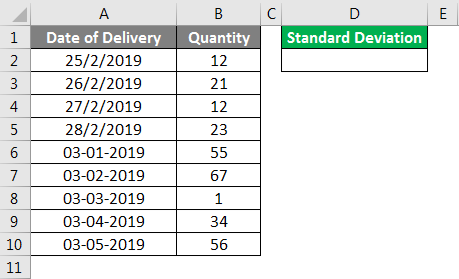
We have sample sales data of a product, where we observed a huge deviation in the sale for 10 days. Now let’s see and calculate how much deviation we are getting for the selected data set.
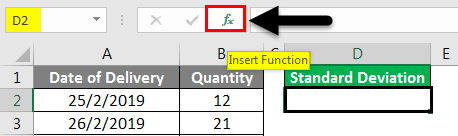
For calculating standard deviation, first, go to the cell where we need the output. Then go to the insert function option beside the formula bar, as shown below.
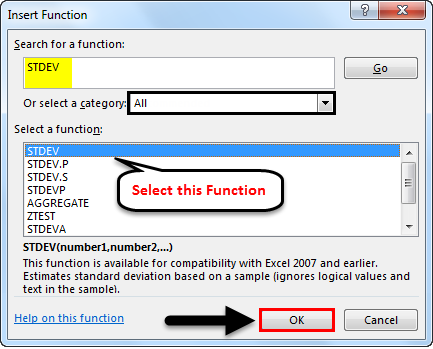
Once we do that, we will get the Insert Function box. From here, select the Standard Deviation function, which is available as STDEV from the Statistical category Or select a category, or from there, select ALL category to look for the required function as shown below. Once we are done with selecting the function, click on OK.
Once we click OK, it will take us to the Function Argument of Standard Deviation. Now we will see two number ranges, Number1 and Number2. Go to Number 1 and select the complete range. Here we have selected a range from cell B2 to B10.
Note – Any number range can accommodate only 255 cell count. If it exceeds, we can use Number2, Number3… and so on.
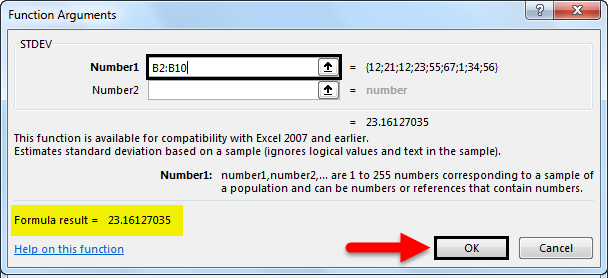
As we can see in the above screenshot, we already have a formula result at the bottom left of the box for the selected range. If the selected range is incorrect, no value will be shown.
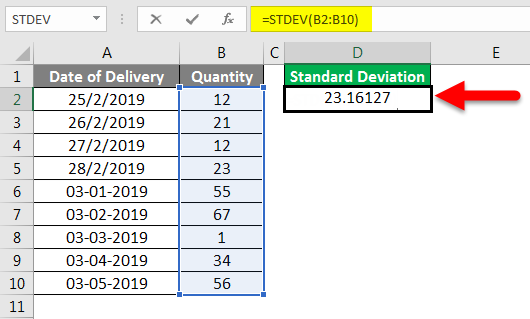
After clicking OK, we can see the selected range’s standard deviation in the selected cell.
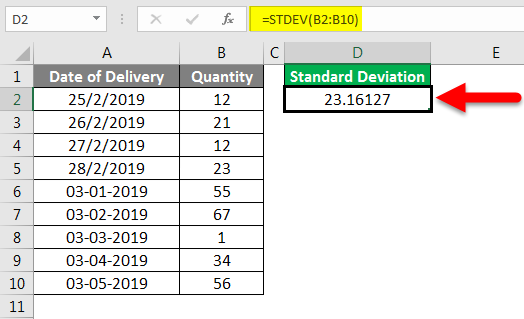
Now let’s understand what it means. As we can see, our standard deviation value is showing as 23.16127, which means for the selected range, if our mean comes as 31.22, the selected range can deviate 23.16127 about the mean value.
Standard Deviation Formula in Excel – Example #2
There is another way to calculate the Standard Deviation formula in Excel. Let’s consider the same data we have seen in the above example.
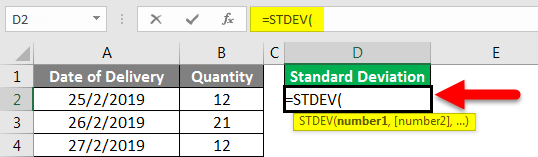
For calculating the standard deviation formula in Excel, go to the cell where we want to see the result and type the ‘=’ (Equal) sign. This will enable all the inbuilt functions in Excel. Now, search for Standard Deviation by typing STDEV, the keyword to find and select, as shown below.
Now select the complete range. Here we have selected the range from cell B2 to B10.
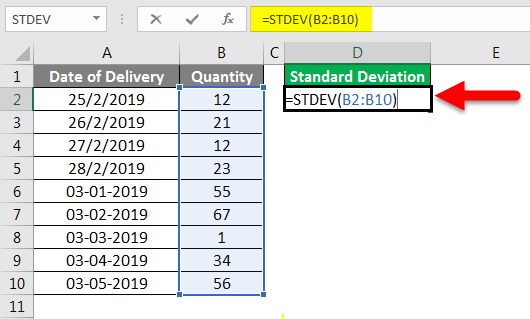
Press Enter to exit the edit mode, and we will see the calculated standard deviation value, as shown below.
As we can see, the standard deviation value is coming as 23.16127. We can also calculate the mean value of the same data to compare how much deviation of data we get about the mean value with the AVERAGE formula’s help.
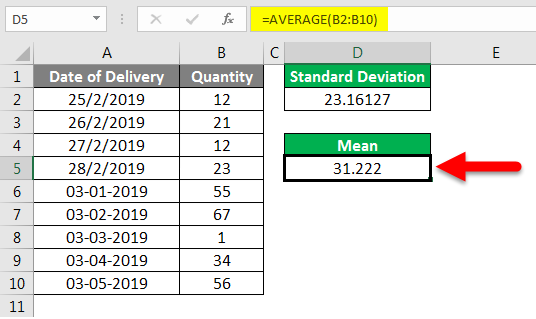
We have shown how standard deviation and mean are connected for the demonstration. The mean value of 31.222 is at the centerline of the whole range, and the Standard Deviation is a little far away from the mean value. It can be towards both sides of the mean.
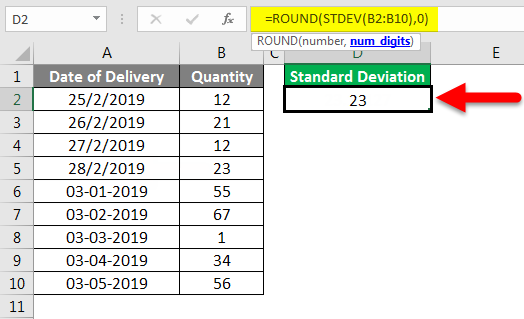
Also, for the value with decimal digits up to 4 and 5, we can make it in the round figure using the ROUND function before the standard deviation. For the type ROUND before STDEV and select the num_digit as 0, as shown below. Once we press Enter, we will get the standard deviation round figure value, as shown below. This will give us the perfect rounded value, which we can use further for other analyses.
Standard Deviation Formula in Excel – Example #3
Let’s see another Excel data set for Standard Deviation calculation, as shown below.
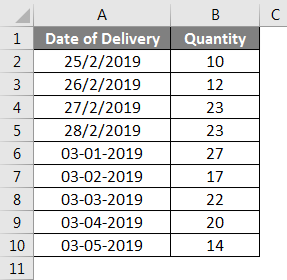
Now, as shown in the above example 1 and 2, calculate the Standard Deviation and Mean.
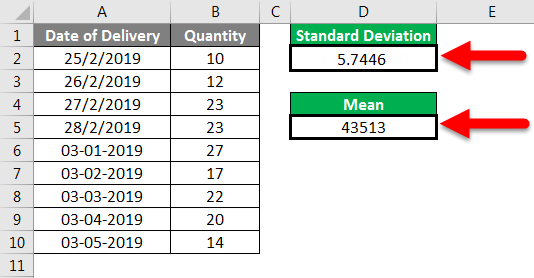
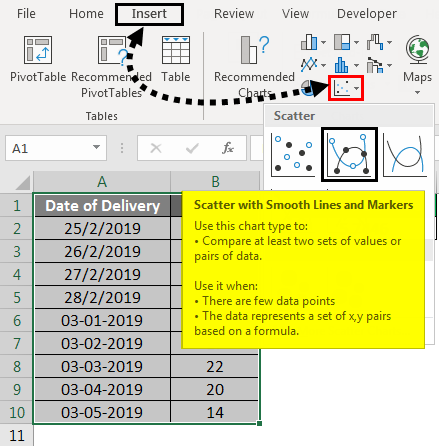
Now for plotting it on a graph, select the complete data and go to Insert Menu; under Charts, select Scatter chart with Smooth Lines and Markers, which is best suited for plotting Standard Deviation as shown below.
Once we click on it, we will get the points plotted on the Standard Deviation graph, as shown below.

As we can see above, we got a curve, and all the points are in their range.
Things to Remember
- Select the complete range. If there is any cell break, consider the cell break and include that in the range.
- Always consider the reference of the Mean value so that the calculated standard deviation can be measured.
- The standard deviation formula in Excel always deviates from both sides of the mean value, but it can sometimes be skewed towards any of the axes.
Recommended Articles
This has been a guide to the Standard Deviation Formula in Excel. Here we discussed How to Calculate Standard Deviation using Formula in Excel, practical examples, and a downloadable Excel template. You can also go through our other suggested articles –
