Earnings Per Share Meaning
Earnings per share (EPS) is a financial performance indicator that helps calculate a company’s profitability by dividing net income and weighted shares outstanding.
It helps investors calculate the capital generated from every share it holds, allowing them to gauge its profitability. For Instance, Amazon’s EPS for the third quarter of 2022 is $0.28. Therefore, each of Amazon’s investors received $0.2 for each dollar they invested.
A higher ratio is preferable because it indicates a better return on the amount invested in purchasing the share. Therefore, investors usually consider this metric and the share price as significant decision-making factors while analyzing the stocks of companies within the same industry.
Key Highlights
- Earnings Per Share is a financial ratio that measures a company’s profitability and analyzes each stockholder’s income.
- We can calculate it by subtracting preferred shares from the net income and dividing it by the number of outstanding shares.
- It is of five types: retained, cash, book value, etc.
- It indicates a company’s profit for each share of its stocks and finds its market value.
- It is essential for shareholders or investors as it helps them make wise yet profitable decisions while purchasing a stock.
Formula
The formula divides the net income generated and the distributed preferred dividend by the weighted average number of outstanding shares.
Mathematically, the equation is,
- Net income is the amount that relates to shareholder equity after deducting the costs and expenses from a company’s profit or income.
- A preferred dividend is the sum of dividends due on a company’s selected stock from the company’s earnings.
- Weighted average no. of shares outstanding: It is the number of outstanding shares of a company estimated after accounting for share capital variations over a fiscal quarter
Earnings Per Share on Income Statement
We can usually find it on a company’s income statement. It is present after the net income, i.e., at the end of the consolidated income statement. Here only the overall value is present.
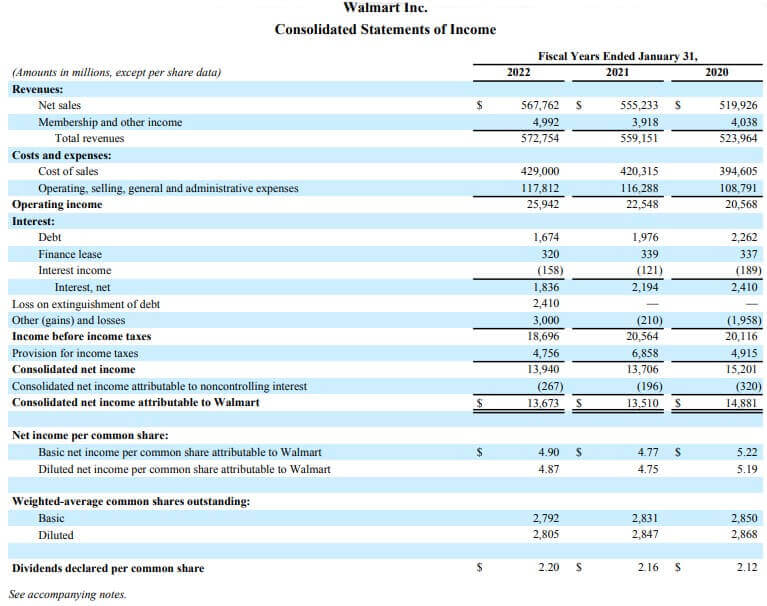
(Image Source: Walmart Annual Report 2022)
Later in the annual report, there is a breakdown for each component from the financial statement. Each part is in a note with a serial number. As seen below, the per-share breakdown is available in the second note.
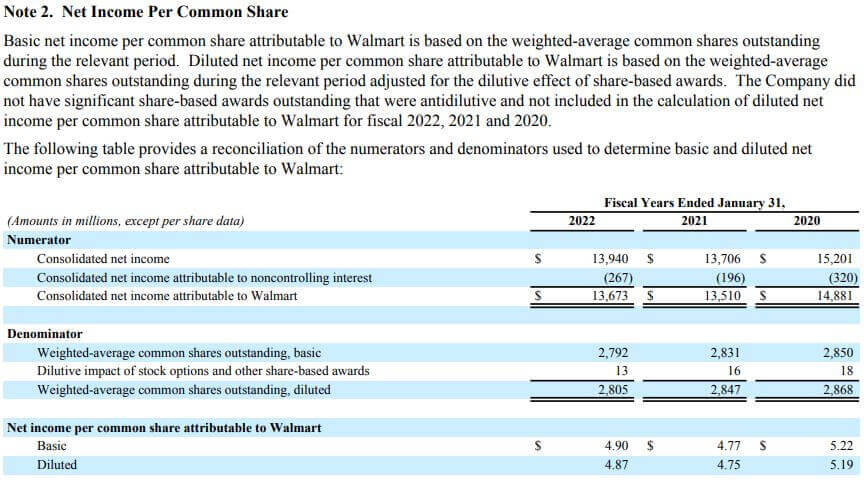
(Image Source: Walmart Annual Report 2022)
How to Calculate? – Real Company Excel Examples
Example #1:
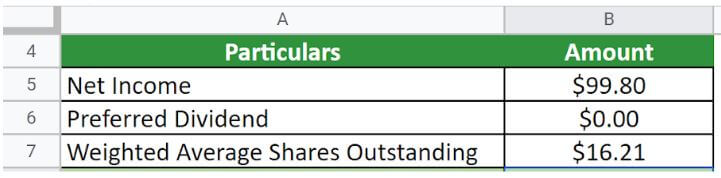
Let us take the example of Apple Inc. to illustrate the computation. The company reported a net income of $99.8 billion in 2022. Calculate the EPS of Apple Inc. for the year 2022 if the weighted average common shares outstanding is 16.21 million.
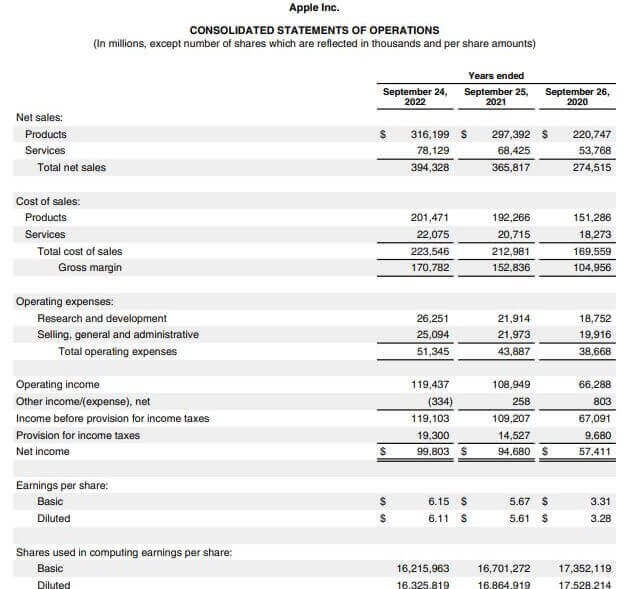
(Image Source: Apple Inc. Annual Report 2022)
Solution:
Given,
Implementing the formula,
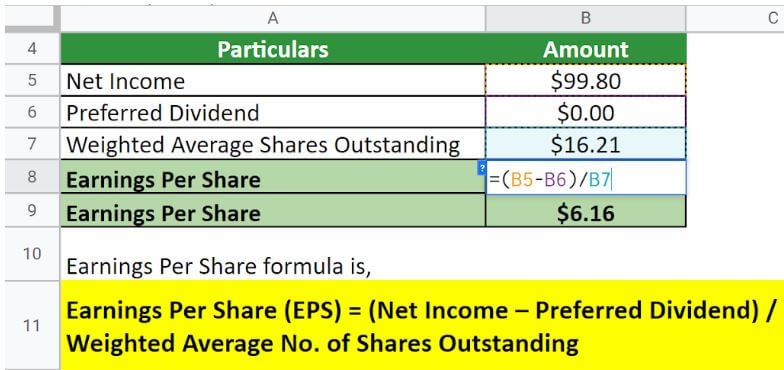
Therefore, Apple Inc. generated an EPS of $6.16 per share in 2022.
Example #2:
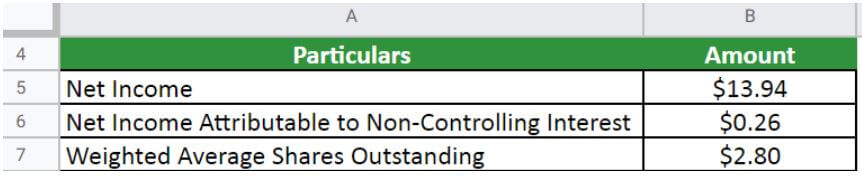
Let us take the example of Walmart Inc. to illustrate the computation. The company reported a net income of $13.94 billion in 2022, of which $0.26 billion is for the non-controlling interest. Calculate the EPS of Walmart Inc. for the year 2022 if the weighted average common shares outstanding is 2.80 billion.
(Image Source: Walmart Inc. Annual Report 2022)
Solution:
Given,
Implementing the formula,
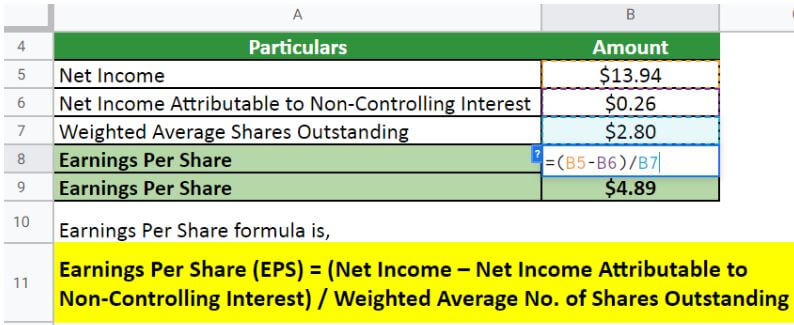
Therefore, Walmart Inc.’s EPS for the year 2022 stood at $4.89 per share.
Example #3
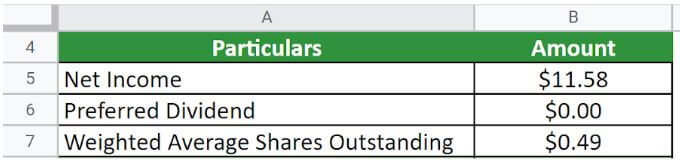
Let us take the example of Amazon.Com.Inc to illustrate the computation. The company reported a net income of $11.58 billion in 2021. Calculate the EPS of Amazon for the year 2021 if the weighted average common shares outstanding is 0.49 billion.
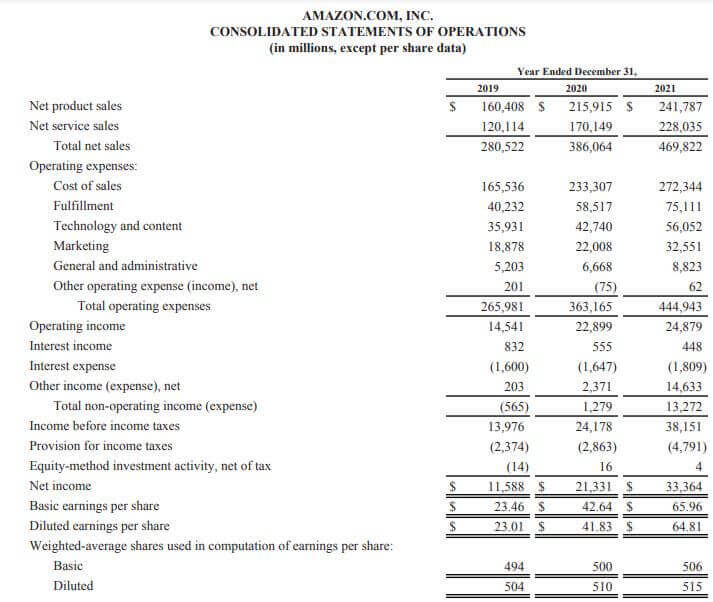
(Image Source: Amazon.Com.Inc. Annual Report 2021)
Solution:
Given,
Implementing the formula,
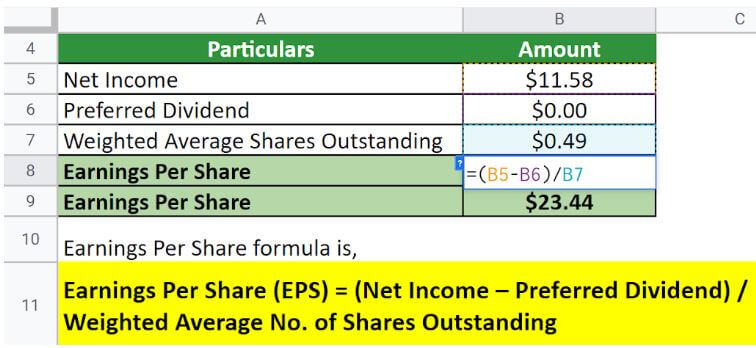
Therefore, Amazon generated an EPS of $ in 2021.
More Examples
Example #1:
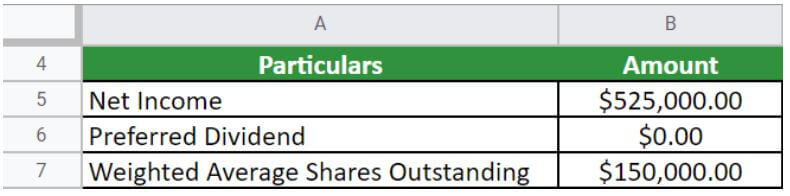
For the year that ended on Dec. 31, 2021, Company XYZ reported a net income of $525,000 and $150,000 common shares outstanding. The company had no preferred stock and neither issued nor repurchased new shares. Therefore, calculate the EPS of Company XYZ.
Given,
Solution:
Implementing the formula,
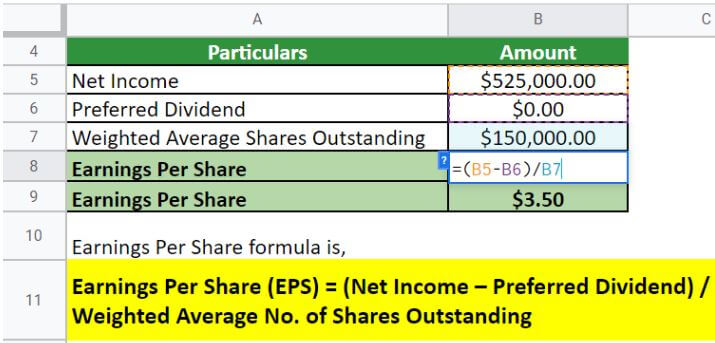
Therefore, the EPS = $3.5 per share
Example #2:
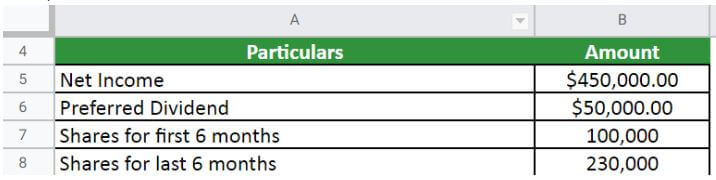
A Telecom Company generated a net income of $450,000 and had 100,000 outstanding shares for the first six months and 230,000 for the year’s second half. The company paid $50,000 in preferred dividends during this year. Therefore, calculate the EPS of the Telecom company.
Given,
Solution:
Let us first calculate the weighted average,
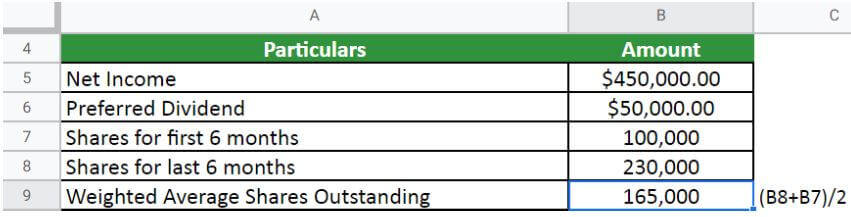
So, the weighted average outstanding shares are 165,000.
Implementing the formula,
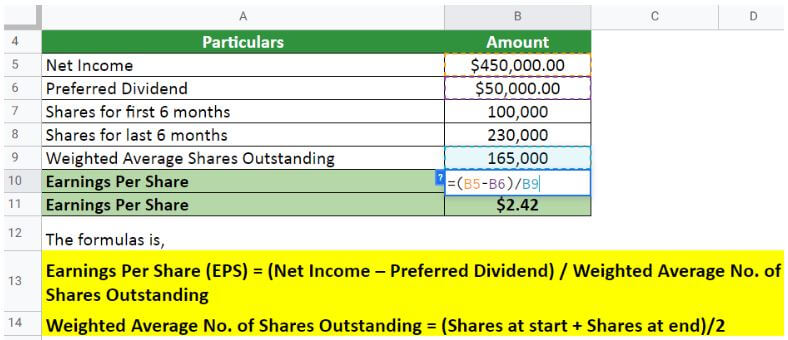
Therefore, the EPS = $2.42 per share
Basic vs. Diluted EPS
|
Basic |
Diluted |
| It is the basic earnings of a company per outstanding share. | The revenue of a company is applicable for every convertible share. |
| It is less important to the investors as it doesn’t reflect the convertible shares. | It is of more importance to investors as it holds convertible shares. |
| It helps calculate the net profit made by a company. | It also helps in calculating the net profit but with convertible securities. |
| It is not very accurate and entails detailed information. | It is very accurate and gives very detailed information. |
| It is effortless to comprehend. | It is complex and hard to comprehend. |
| It uses the common shares for calculation. | It uses common and preferred shares, stock options, debt, warrants, etc., for calculation. |
Types
#1 Reported or GAAP
- It is the figure obtained from GAAP or Generally Accounting Principles.
- GAAP can alter the reported income of a company
- For instance, if a company counts the regular expense as unusual, it will be excluded from the calculation, thus boosting the value artificially.
#2 Ongoing or Pro-Forma
- It entirely depends on the general net income, excluding everything that could be an unusual one-time event.
- It is unarguably the best indicator for future EPS as it helps to find out the source of earnings from the base operations.
#3 Carrying or Book Value
- It helps determine the amount of a company’s equity in each share.
- It is majorly as per the balance sheet. Therefore, it is considered a stationary representation of a company’s performance.
#4 Retained
- It represents the profit a business chooses to keep rather than pay out as dividends to its shareholders.
- It is calculated by adding the net earnings to the current retained profits and subtracting the total dividend paid. Ultimately, divide the remainder by the total number of weighted average shares.
#5 Cash
- It is beneficial as it helps find a company’s financial position in the market.
- It is a raw number (as it depicts the real profit earned) and, thus, can’t be altered like the net income.
How do the Stock Dividends & Splits Affect it?
Stock dividends are the dividend allocation of stocks instead of capital to existing shareholders. It does not entirely affect the share earnings as the increase in the number of shares is negligible. However, if the number of shares increases by a vast number, the EPS value will drop to a lower ratio.
On the contrary, stock splits are the division of existing shares into a definite proportion. Due to the split declaration, there’s an increase in the number of shares a company holds. Thus, it will result in lower EPS since the number of shares grows while the profit earned remains constant.
For Example, Company ABC did a 5-1 stock split in November 2022. Its EPS before the split was $10, while total shares stood at 100,000. After the split, the total shares are 500,000, which lowers the EPS to $2. Their profit both before and after the split was constant, i.e., $1,000,000.
Earnings Per Share vs. P/E Ratio
|
Earnings Per Share |
P/E Ratio |
|
Definition |
|
| It indicates a company’s profitability. | The P/E pr price earning ratio is an indicator of a stock’s valuation for a company. |
|
Calculation |
|
| Dividing a company’s net income by the weighted average number of shares. | Dividing a company’s stock value by the EPS. |
|
Importance |
|
| It helps investors and analysts assess a company’s stock before investing. | The P/E ratio helps compare a company’s stock to its competitors. It can also help find out if a stock is over or undervalued. |
|
Limitation |
|
| It doesn’t consider a company’s debt. | It is entirely according to the historical data of a company. |
Why is it Important for Shareholders?
- Investors need to pay close attention to this value as it can drive the stock price. The stock price will probably increase if a company’s per-share earnings are high.
- It helps investors know if investing in a specific company will be profitable. A company with a consistent ratio indicates its profitability, making ways for it to pay higher dividends.
- It is an excellent indicator of a company’s performance and helps choose a promising company since it is the input in the P/E or Price or earning ratio.
- It can even help understand a company’s financial status and gauge its historical performance.
Advantages & Disadvantages
|
Advantages |
Disadvantages |
| It usually is a measure to price the stocks such that stocks with higher value attract higher prices. | The companies can manipulate this value by reducing the number of outstanding shares by buying back their own or reverse splitting stocks. |
| It captures the overall profit per share after paying off all the liabilities, such as interest on the debt, the dividend for preference shareholders, etc. | It doesn’t capture the company’s performance as it fails to consider the share’s price. |
| The calculation is straightforward, where we take the total income and divide it by the outstanding shares. | If a company is going into a loss, it has a negative ratio, and it isn’t easy to measure such a company. |
Calculator
Use the following calculator for the Earnings Per Share calculations:
| Net Income | |
| Preferred Dividend | |
| Weighted Average No. of Shares Outstanding | |
| Earnings Per Share = | |
| Earnings Per Share = | (Net Income - Preferred Dividend) / Weighted Average No. of Shares Outstanding |
| = | (0 - 0)/ 0 = 0 |
Final Thoughts
Although EPS is a critical metric for investors, it should be seen with the share price to draw meaningful insights. One should also keep track of any change in the outstanding number of shares due to stock splits, reverse splits, share repurchases, etc.
Frequently Asked Questions (FAQs)
Q.1 What do earnings per share mean?
Answer: Earnings per share is a financial method of calculating a company’s overall profit by dividing its net income by the average number of shares outstanding.
The formula for the same is
EPS = (Net Income – Preferred Dividend) / Weighted Average No. of Shares Outstanding Share.
Q.2 What is a good earnings-per-share ratio?
Answer: A good EPS depends entirely on the company and its performance under market expectations. Typically, a higher ratio contributes to a profitable deal. However, a higher value is not an indicator of future performance.
Q.3 How do you calculate earnings per share?
Answer: The EPS is the company’s total or net income for every outstanding share. We calculate it by dividing the company’s total revenue by the weighted a of common shares outstanding.
Q.4 What are the types of earnings per share?
Answer: There are five types of earnings per share which are named as Reported or GAAP, Ongoing or Pro Forma, Carrying or Book Value, Retained, and Cash. An investor must understand and comprehend all the types to make an effective stock decision.
Q.5 What does it mean if EPS is negative?
Answer: An EPS Is negative if a company’s net income is negative, indicating the company is spending or losing more money than earning. However, it is essential to understand that a negative value doesn’t always relate to the stock sale.
Q.6 What is adjusted earnings per share?
Answer: Adjusted EPS is a calculation where an analyst deploys some adjustments to the numerator part. The aim is to remove or add the derivatives of net income that are non-recurring.
Q.7 How to increase earnings per share?
Answer: A company may look to repurchase its shares in the market to improve or increase its EPS. This way, a company doesn’t have to increase its net income. Furthermore, a good ratio always comes from dividing net income by fewer shares.
Recommended Articles
This is a guide to Earnings Per Share. Here we discuss how to calculate it along with real-life examples. You may also look at the following articles to learn more –

