Updated July 26, 2023
Earnings Per Share Formula (Table of Contents)
What is Earnings Per Share Formula (EPS)?
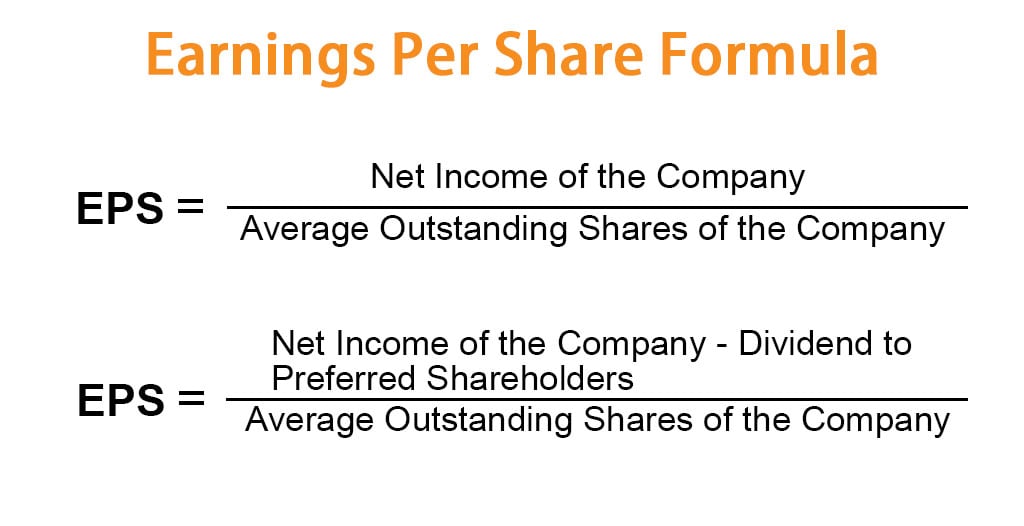
Earnings per share (EPS) is the company’s net income allocated among each outstanding common share. The mathematical representation of the formula is:
If a company has preferred shareholders, then the earnings per share are calculated using the below formula:
Examples of Earnings Per Share Formula (With Excel Template)
Let’s take an example to understand the calculation of Earnings Per Share in a better manner.
Earnings Per Share Formula – Example #1
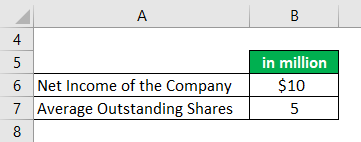
Assume ABC Corporation’s reported net income for FY18 was $10 million, and the average outstanding common shares for FY18 were 5 million. Then, calculate Earnings per share for the company.
Solution:
The formula to calculate Earnings Per Share is as below:
Earnings Per Share (EPS) = Net Income of the Company / Average Outstanding Shares of the Company
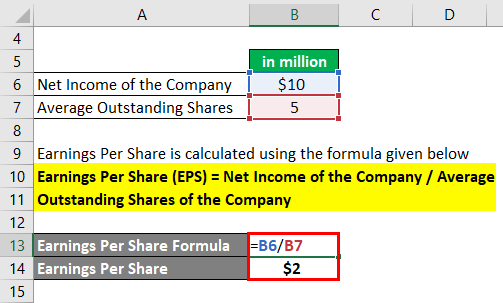
- Earnings Per Share (EPS) = $10 million / 5 million
- Earnings Per Share (EPS)= $2
Earnings Per Share Formula – Example #2
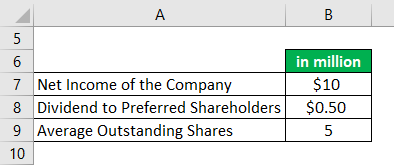
Assume ABC Corporation has preferred shareholders. The company reported a net income of $10 million for FY18 and declared a total dividend of $0.50 million to preferential shareholders. The total average outstanding common shares of the company were 5 million. Calculate Earnings per share for the company.
Solution:
The formula to calculate Earnings Per Share is as below:
Earnings Per Share (EPS) = (Net Income of the Company – Dividend to Preferred Shareholders) / Average Outstanding Shares of the Company

- Earnings Per Share (EPS)= ($10 – $0.50) million / 5 million
- Earnings Per Share (EPS) = $1.90
Earnings Per Share Formula – Example #3
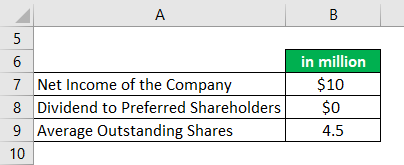
Assume ABC Corporation reported a net income of $10 million for the fiscal FY18. The company’s outstanding common shares at the start of fiscal FY18 were 5 million. During the fiscal FY18, the company made a buyback of 1 million common shares from the open market. Therefore, the company doesn’t have preferential shareholders as per reported financials for FY18.
Solution:
After the buyback of 1 million shares, total common shares outstanding at the end of FY18 =4 million
Assuming the company buyback plan was executed at the end of June 2018, the weighted average common outstanding shares for the Company are
= ((6months/12 months) *(5 million)) + ((6months/12 months) *(4 million))
= (½)* (9 million) = 4.5 million shares
Weighted average common outstanding shares = 4.5 million
The formula to calculate Earnings Per Share is as below:
Earnings Per Share (EPS) = (Net Income of the Company – Dividend to Preferred Shareholders) / Average Outstanding Shares of the Company
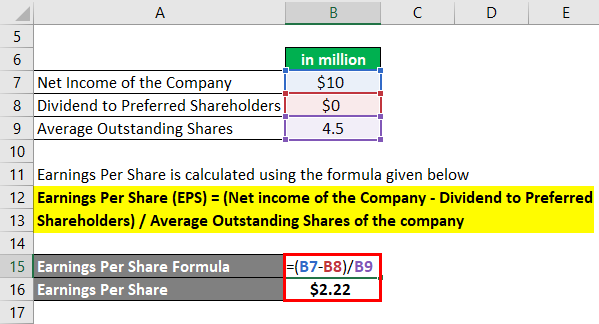
- Earnings Per Share (EPS) = ($10 – $0) million / 4.5 million
- Earnings Per Share (EPS) = $2.22
If we compare example 1 and example 3, the buyback of the shares reduces the total common outstanding shares and improves the company’s earnings per share.
Relevance and Uses of EPS Formula
Investors in the financial world use multiple valuation metrics to value a company’s share prices and compare companies’ valuations in a specific industry. When earnings per share (EPS) is used on a standalone basis, it does not tell much about a company and is not very useful. Because earnings per share use a number of common shares outstanding in the denominator, calculating EPS and value for a share for different companies may be different. Therefore, it may not give a fair view of companies’ earnings in a specific industry if the prices of shares (equity capital) of companies are different.
To demonstrate the above, I have taken an example of three companies operating in the same industries. All the financial numbers, such as net income, number of shares, and price per share, are taken for 2018.
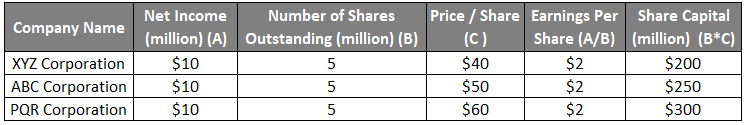
As we can see in the above table, earnings per share for all three companies are the same; however, this is not a correct earnings indicator. Because Company XYZ Corporation generates the same amount of earnings with a lesser share capital than the company’s ABC Corporation and PQR Corporation, we can’t be sure about the earnings performance of all three companies even though all have the same earnings per share. Therefore, earnings have to be compared in association with the share price of the companies.
A very useful and important metric for valuation when used with the price of the share.
Using earnings per share in conjunction with the share price provides a fair assessment of the valuation of a company’s share. When we combine earnings per share and the share price for analysis, we come across useful metrics, i.e., the P/E ratio.
P/E Ratio= Price Per Share of the Company / Earnings Per Share of the Company
Now let’s look at the below table, wherein the P/E ratio has been calculated and included in the table:
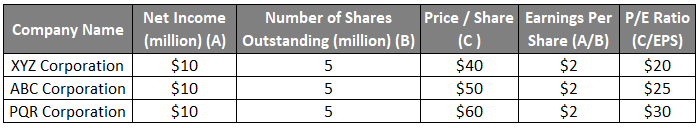
We can see from the above table that PQR Corporation has the highest P/E ratio, and XYZ Corporation has the lowest P/E ratio. This means PQR Corporation is relatively higher valued than XYZ Corporation and ABC Corporation. This can give important insight to investors (along with other financial metrics) on the company’s relative valuation. A lower P/E ratio indicates a lower valuation and often makes a company/stock an attractive investment bet (if other company fundamentals are intact).
The investor community widely uses the P/E ratio, which combines earnings per share with the share price, as an important valuation metric.
Earnings Per Share Formula Calculator
You can use the following Earnings Per Share Calculator
| Net Income of the Company | |
| Dividend to Preferred Shareholders | |
| Average Outstanding Shares of the Company | |
| Earnings Per Share (EPS) | |
| Earnings Per Share (EPS) = |
|
|
Recommended Articles
This is a guide to the Earnings Per Share Formula. Here we discuss How to Calculate Earnings Per Share along with practical examples. We also provide a Earnings Per Share Calculator with a downloadable Excel template. You may also look at the following articles to learn more –
