Updated July 25, 2023
Definition of Diluted Earnings Per Share
The term “diluted EPS” is an acronym for diluted earnings per share. It refers to the distribution of the company’s net earnings to the stockholders based on the assumption that all the securities (such as convertible preferred shares, employee stock options, warrants, convertible bonds, etc.) that have the option to convert into common shares will be duly executed during the given period of time.
In other words, the calculation of diluted earnings per share considers the impact of common shares and convertible securities to show what might happen to earnings distribution if all the convertible securities were turned into common shares overnight. In this way, the underlying theory for diluted EPS is exactly the opposite of basic EPS.
Formula
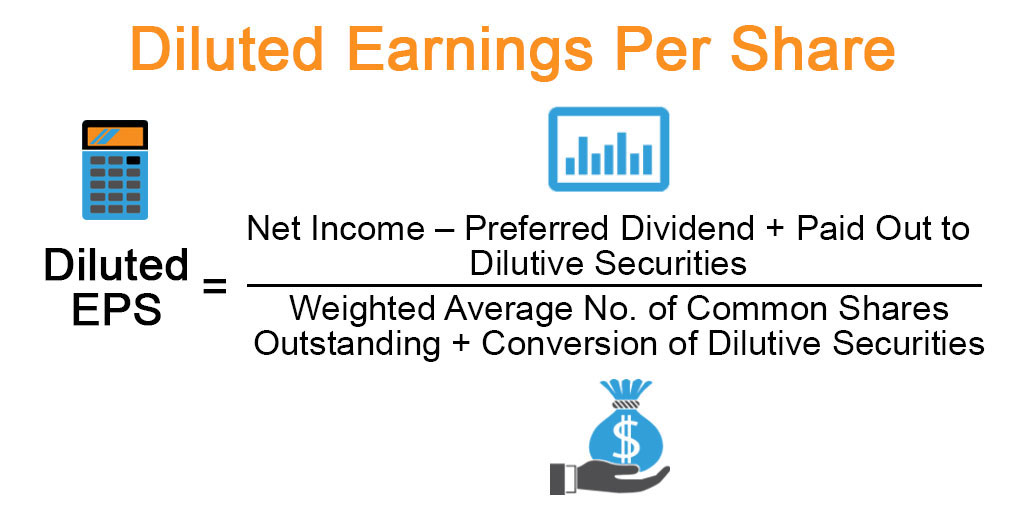
The formula for diluted EPS can be derived by dividing the difference between the net income generated by the company and preferred dividends paid (adjusted for payment made to the dilutive securities) by the summation of the weighted average number of common shares outstanding and conversion of dilutive securities. The mathematical representation of the formula is as below:
Examples of Diluted Earnings Per Share(With Excel Template)
Let’s take an example to understand the calculation of Diluted Earnings Per Share in a better manner.
Example #1
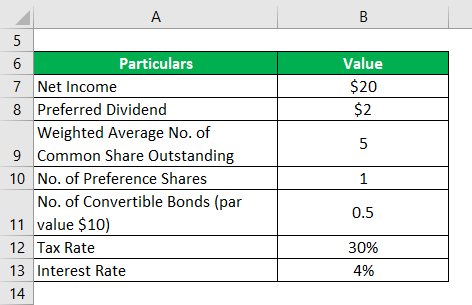
Let us take the example of a company named GHJ Inc. to illustrate the computation of diluted Earnings Per Share. In 2018, the company registered a net income of $20 million, out of which it paid out $2 million to the owners of the 1 million preference shares in the form of dividends. 60% of the preference shares are convertible into 1:1 common stock. Further, it had 500,000 bonds (par value of $10, interest rate 4%, convertible to 1 common stock each) besides the weighted average number of common shares outstanding of 5 million. Calculate the diluted EPS of GHJ Inc. for 2018 if the effective tax rate is 30%.
Solution:
The formula to calculate Paid out to Dilutive Securities is as below:
Paid out to Dilutive Securities = 60% * Preference Dividend + No. of Convertible Debt * Par Value * Interest Rate * (1 – Tax Rate)
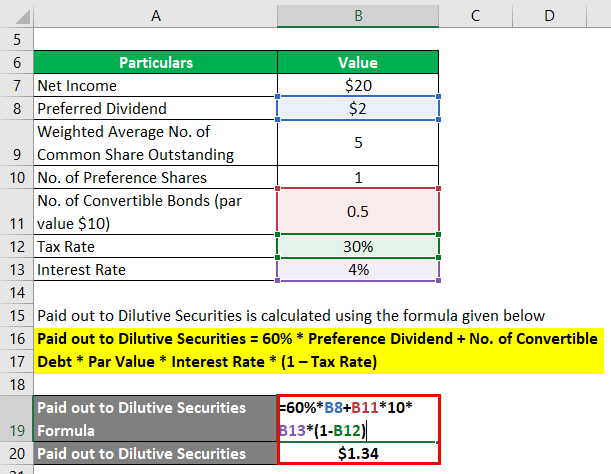
- Paid out to Dilutive Securities = 60% * $2 million + 0.5 million * $10 * 4% * (1 -35%)
- Paid out to Dilutive Securities = $1.34 million
The formula to calculate the Conversion of Dilutive Securities is as below:
Conversion of Dilutive Securities = 60% * No. of Preference Shares + No. of Convertible Debt
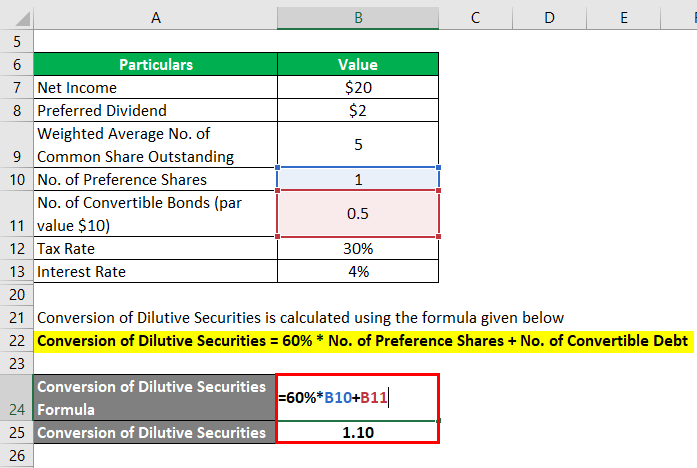
- Conversion of Dilutive Securities = 60% * 1 million + 0.5 million
- Conversion of Dilutive Securities = 1.10 million
The formula to calculate Diluted Earnings per Share is as below:
Diluted EPS = (Net Income – Preferred Dividend + Paid out to Dilutive Securities) / (Weighted Average No. of Common Shares Outstanding + Conversion of Dilutive Securities)
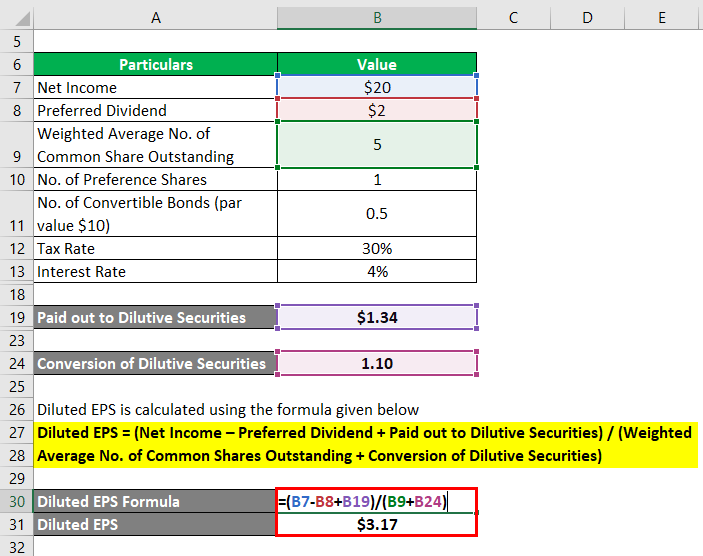
- Diluted EPS = ($20.0 million – $2.0 million + $1.34 million) / (5.0 million + 1.1 million)
- Diluted EPS = $3.17 per share
Therefore, GHJ Inc. managed a diluted EPS of $3.17 per share during the year 2018.
Example #2
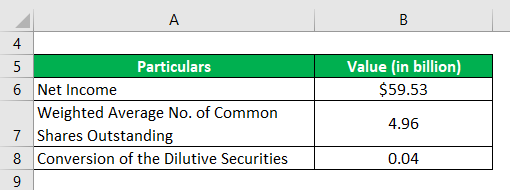
Let us take the example of Apple Inc. to show how diluted Earnings Per Share is calculated in most cases practically. As per the latest annual report 2018, the company generated a net income of $59.53 billion. Further, during the year, the company’s weighted average number of common shares outstanding was 4.96 billion, while the impact of conversion of the dilutive securities was 0.04 billion. Determine the diluted EPS of the company for the year 2018.
Solution:
The formula to calculate Diluted Earnings Per Share is as below:
Diluted EPS = (Net Income – Preferred Dividend + Paid out to Dilutive Securities) / (Weighted Average No. of Common Shares Outstanding + Conversion of Dilutive Securities)
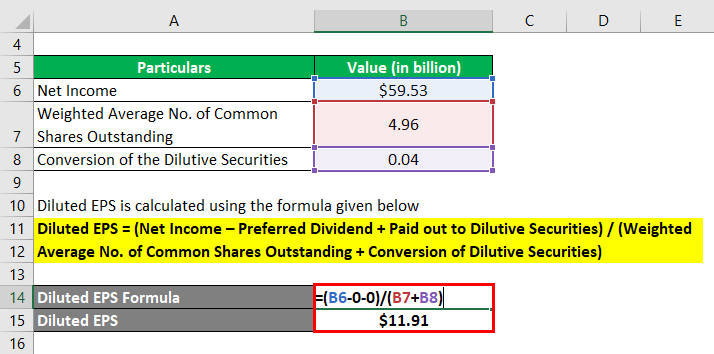
- Diluted EPS = ($59.53 billion – 0 + 0) / (4.96 billion + 0.04 billion)
- Diluted EPS = $11.91 per share
Therefore, Apple Inc.’s diluted EPS comes down to $11.91 per share for the year 2018.
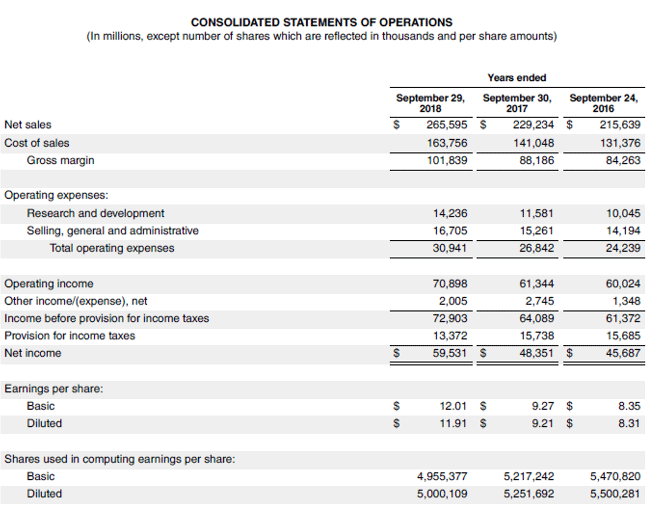
Source Link: Apple Inc. Balance Sheet
Example #3
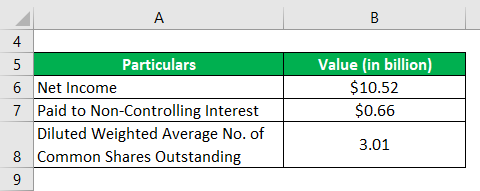
Let us take the example of Walmart Inc. to illustrate the diluted Earnings Per Share calculation. In 2018, the company booked a net income of $10.52 billion, paying out $0.66 billion against non-controlling interest. Further, the diluted weighted average no. of common shares outstanding was 3.01 billion. Calculate the diluted EPS of Walmart Inc. for the year 2018.
Solution:
The formula to calculate Diluted Earnings Per Share is as below:
Diluted EPS = (Net Income – Paid to Non-Controlling Interest + Paid out to Dilutive Securities) / Diluted Weighted Average No. of Common Shares Outstanding
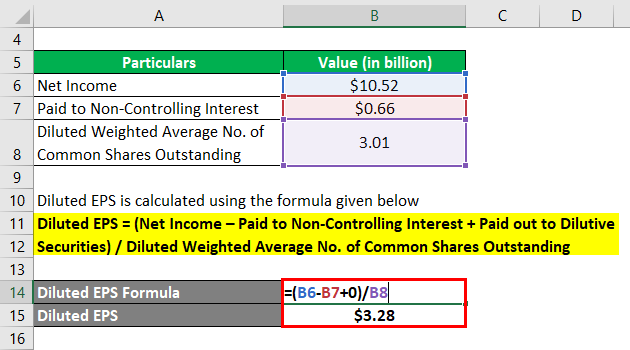
- Diluted EPS = ($10.52 billion – $0.66 billion + 0) / 3.01 billion
- Diluted EPS = $3.28 per share
Therefore, Walmart Inc.’s diluted EPS for the year 2018 stood at $3.28 per share.
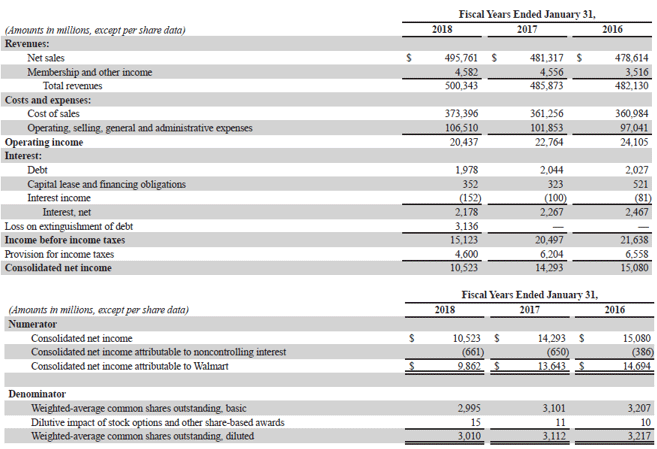
Source: Walmart Annual Reports (Investor Relations)
Advantages of Diluted Earnings Per Share
Some of the major advantages of diluted earnings per share are:
- It determines the Earnings Per Share while considering the potential impact of converting all dilutive securities into common stock.
- Lower scope for manipulation given that all convertible securities are captured.
- It helps in comparing the EPS among peers with varying capital structures.
Limitations of Diluted Earnings Per Share
Some of the major limitations of diluted earnings per share are:
- It involves a complex set of calculations that includes conversion, bond tax benefits, etc.
- It is still exposed to the vagaries of financial account manipulation.
Conclusion
So, it can be concluded that diluted earnings per share are a more comprehensive indicator of a company’s earnings than the basic EPS. However, it needs to analyze in conjunction with the stock price and the outstanding number of common shares to draw true financial insights.
Recommended Articles
This is a guide to Diluted Earnings Per Share. Here we discuss how to calculate Diluted EPS along with practical examples. We also provide a downloadable Excel template. You may also look at the following articles to learn more –

