Updated July 21, 2023
Definition of Dependency Ratio
Dependency Ratio is the percentage of people in the age group who are financially dependent on working-class people and describes the country’s social and population structure. It helps the country’s government to manage policies.
It calculates the number of people in a country who are dependent compared to the number of the working-class population. The simple formula where the number of people from age group zero to fourteen and people above 65 is divided by the number of working-class people i.e. age between fifteen and sixty-five. This ratio tells how much burden the country bare to support the non-working class population i.e. country’s working population is bare in supporting the non-working class population. Since the government supports people in the non-working age group with taxes collected from the working-class population’s income, this ratio shows the picture of the country’s social balance.
To understand the world scenario United Nations releases data every five years since 1950. World Bank also releases dependency data but the difference between World Bank data and United nation data is World Bank only considers the non-working age group as people above 65 years and not children.
Formula
- High dependency ratio means a high burden bare by the young population to manage the expenses of the dependent population through childcare, education, and pensions.
- Since children become adults and part of the working population in the future, and part of the working population’s expenses on their growth is considered an investment instead of spending, many times different ratios are calculated for children and senior citizens. High ratio means a high burden bare by the young population to manage the expenses of the dependent population through childcare, education, and pensions.
Example of Dependency Ratio (with Excel Template)
Let’s take an example to understand the calculation in a better manner.
There are two countries, ABC and XYZ, with 200,000 and 400,000 people. Data gathered from each country’s government tells us that:
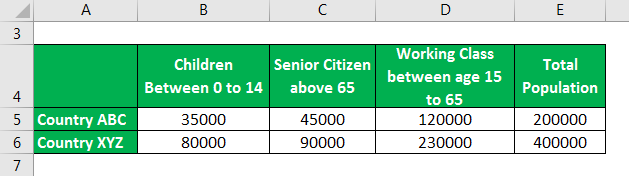
Solution:
It is calculated using the formula given below.
Dependency Ratio = [(Total Number of Children under age 14) + (Total Number of Senior Citizens above age 65)] / Total Number of People from the age group of 15 to 65 *100
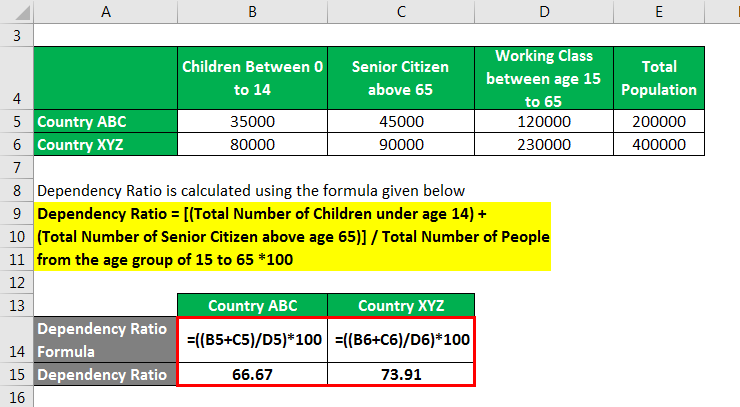
For Country ABC:
- Dependency Ratio = (35,000 + 45,000) / 120,000 X 100
- = 66.67%
For Country XYZ:
- Dependency Ratio = (80,000 + 90,000) / 230,000 X 100
- = 73.91%
Child Dependency Ratio is calculated using the formula given below.
Dependency Ratio = Total Number of Children Under Age 14 / Total Number of People from the age group of 15 to 65 * 100
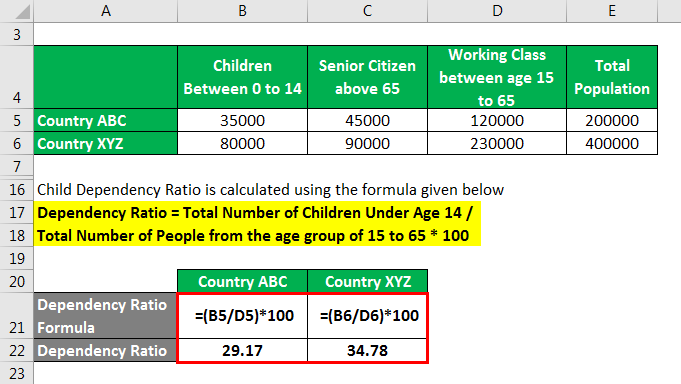
For Country ABC
- Dependency Ratio = 35,000 / 120,000 X 100
- = 29.17%
For Country XYZ
- Dependency Ratio = 80,000 / 230,000 X 100
- = 34.78%
Senior Citizen Dependency Ratio is calculated using the formula given below.
Dependency Ratio = Total Number of Senior Citizens above age 65 / Total Number of People from the age group of 15 to 65 *100
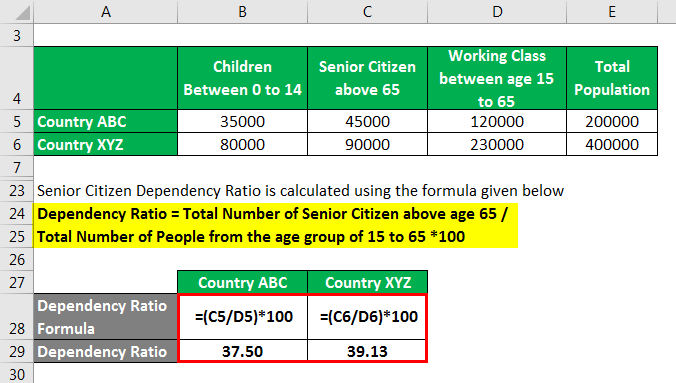
For Country ABC
- Dependency Ratio = 45,000 / 120,000 X 100
- = 37.50%
For Country XYZ
- Dependency Ratio = 90,000 / 230,000 X 100
- = 39.13%
From the above calculations, we can say in terms of total dependency. Country ABC looks better than XYZ as there is less burden on the working class.
However, there is more than a 5% difference in Children and less than a 2% difference in Senior citizens between ABC and XYZ, which means child dependency, is more in XYZ. This Ratio can change in the future in favor of XYZ.
Importance
Below are the important points we should learn:
- Social and Economic Development: It describes the population structure in the country and its effect country’s economic and social development in the future. This data will help the country and the world government make future policies and budget adjustments.
- Change in ratio brings population structure and change in development: High dependency ratio means the country’s youth population bears the dependent population’s huge burden. Services needed for childcare, education, pension, healthcare, and other services are funded by taxes charged on the income of the working-class youth population. While a low indicates the country has a high working-class youth population. As time passes dependency ratio changes, for which the government should be prepared for the future.
- International standards and targets: In 2005, 66 percent of countries’ governments reported concern about the low level of the working-age population. Around 52 percent of those countries reported concern about the increasing aging population, i.e., senior citizens, and the burden their economy has to bear over a period. This situation increases the burden on the working class, which might result in a socially unstable environment as time passes because the government might require charging high taxes.
- Indicators from the past: The dependency ratio is the result of the past demographic of the country, the level of fertility and mortality, and the country’s development over the years. It shows the country’s growth trend in terms of health care, gender equality, social situations, business and investment in the country, and technology development.
Advantages and Disadvantages
Below we will learn the points that explain the limitation and benefits:
Advantages
- Structure of Population: The dependency ratio describes the structure of the country’s population in terms of working and dependent. This data help the government and people to manage their budget and adjust their health for the future.
- Policy Structure for the Future: Data from this ratio helps the government make necessary future policy changes to avoid social and economic issues. Many countries with high ratios promote immigration, so working-class populations from other countries will immigrate with their family and have children. This will help them manage the dependency ratio in the future as, over a period, children from these families will turn into working-class populations and help the country’s growth. Many governments support promoting fitness activities in youth to avoid health issues and medical expense burdens on the government. While some governments subsidize child care to promote fertility so families can have more children, which will help a country’s economy when these children become adults and turn into the working-class population.
- Tax Structure: It helps the government to design tax structures for services like childcare and healthcare; pensions are funded through taxes from the income of the working-class population.
Disadvantages
- Approximation of Data: It does not provide accurate information as data suggest that many children below age 15 and senior citizens above age 65 are not completely dependent. This ratio assumes people below age 15 and above age 65 are economically dependent, and people between ages 15 to 65 are working-class populations. The country’s employment level, labor policies, and the number of entrepreneurs in the country are from different age groups, which affects the real dependency ratio. It proves the ratio is flawed in terms of information.
- Ignores Other Factors: It ignores other factors like the level of unemployment. The competition in employment, which needs higher education and training, makes many young adults remain out of work to get advanced knowledge and training.
- Does not Describe Social Structure in Reality: Although it said to describe the social structure of the country, which can be a false statement as gender neutrality, educational development, social security, and law enforcement is an important parts of the country’s social structure, which is not considered during the calculation of this ratio. It calculates only numbers, which can be misleading.
Conclusion
It helps in understanding and estimating the structure of the population to the government of the country and world, which helps them to prepare for the future through policy changes to manage issues arising in the future; at the same time, it describes the growth in terms of technology, health care, the business country has made over years. It only considers the number gathered from age groups instead of actual numbers of working and dependent populations, which makes this ratio difficult to understand as it does not provide a clear picture of the economy. The government does not make decisions solely based on the dependency ratio but also gathers data from other sources and indicators suggesting different scenarios.
Recommended Articles
This is a guide to the Dependency Ratio. Here we discuss how to calculate along with practical examples with advantages and disadvantages. We also provide a downloadable Excel template. You may also look at the following articles to learn more –

